What is Forex Dominion?
Do you want to have the best information about the Forex market and trading? Then you are in the right place.
At present, millions of people around the world invest in financial markets and this amount is growing day by day thanks to the many opportunities offered by these markets
Forex, stocks, indexes, commodities, ETFs, and other markets are the places where large and small traders earn and lose large fortunes on a daily basis.
However, trading is not easy. Trading in markets like Forex requires a lot of knowledge, experience, and proper psychology.
In Forexdominion we include abundant educational material about the market, including tutorials about the Forex market, technical analysis, fundamental analysis, trading psychology, and trading strategies.
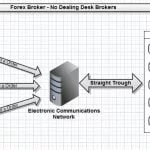
In the world, there are hundreds of stock, futures, Forex, and CFD brokers. Here we show the best brokers in the Forex and CFD sectors, grouped into lists where we classify them according to their main characteristics. For example, we show the best ECN, STP, Market Makers, and DMA Forex brokers.
Recommended brokers
| Best Broker For Novice Traders
| Recommended ECN Broker
|
|---|---|
Best Multi-asset Broker
| Recommended ECN/STP Broker for Beginners
|

Recent articles of Forex Dominion
- How to Execute a Market Order in Metatrader 5Part 4 of the Ultimate MT5 Tutorial Series Introduction You’ve installed MT5, opened a demo account, and toured the interface. Now comes the moment that makes everything feel real: placing your first trade. Don’t worry … Read more
- Navigating the Metatrader 5 Platform: A Tour of the MT5 InterfaceIntroduction Opening MetaTrader 5 for the first time can feel overwhelming. There are panels everywhere, numbers updating in real time, menus inside menus, and toolbars you haven’t learned to read yet. But here’s the truth: … Read more
- How to Buy Stocks with eToro: 5 Basic StepsDiscover how to buy stocks with the broker eToro in 5 steps. With an intuitive interface and by copying the strategies of experienced investors. In this practical guide I’m going to explain how to invest … Read more
- Downloading, Installing, and Setting Up MetaTrader 5: A Complete Step-by-Step GuidePart 2 of the Ultimate MT5 Tutorial Series In the previous article we explained what the Metatrader 5 platform is and what its main advantages and disadvantages are. Now we are going to show how … Read more
- What is MetaTrader 5 and Why Use It?Part 1 of the Ultimate MT5 Tutorial Series Introduction If you’ve spent any time in the world of online trading, you’ve almost certainly heard of MetaTrader. For over a decade, MetaTrader 4 (MT4) stood as … Read more
- List of Crypto Exchanges – Recommended Exchanges 2026Without a doubt, choosing a good cryptocurrency exchange is crucial for trading successfully and safely in an ever-growing and dynamic market. And with so many options available, it is not an easy choice to make. … Read more
- How to program in MQL4 from Visual Studio CodeDear trader, In this article I want to show you how to program in MQL4 from Visual Studio Code. If you have ever used code editors like VSCode or Sublime Text, I am fully convinced … Read more
- The Components of an Algorithmic Trading InfrastructureAs you well know, one of the main advantages of algorithmic trading is that it allows traders to automate their strategies and execute orders at speeds and levels of precision that would be impossible to … Read more
Forex Education
Forex Guide
- How to Execute a Market Order in Metatrader 5
 Part 4 of the Ultimate MT5 Tutorial Series Introduction You’ve installed MT5, opened a demo account, and toured the interface. Now comes the moment that makes everything feel real: placing your first trade. Don’t worry — this guide uses a demo account, so there’s zero financial risk while you learn. … Read more
 - Navigating the Metatrader 5 Platform: A Tour of the MT5 InterfaceIntroduction Opening MetaTrader 5 for the first time can feel overwhelming. There are panels everywhere, numbers updating in real time, menus inside menus, and toolbars you haven’t learned to read yet. But here’s the truth: MT5 follows a very logical layout, and once you understand what each section does, everything … Read more
- What is MetaTrader 5 and Why Use It?Part 1 of the Ultimate MT5 Tutorial Series Introduction If you’ve spent any time in the world of online trading, you’ve almost certainly heard of MetaTrader. For over a decade, MetaTrader 4 (MT4) stood as the undisputed king of retail trading platforms. But the trading world evolves — and so … Read more
- Order Block Trading – Definition and FeaturesThe world of trading is full of tools and strategies that seek to offer the trader an advantage. One of the most advanced and lesser-known techniques is trading based on Order Blocks. This approach, often used by institutional traders, focuses on identifying key areas where large transaction volumes influence market … Read more
- How to invest in palladiumWhen it comes to investing, we should think about diversifying our portfolio. For example, investing in palladium, one of the precious metals that is attracting the most attention, is one way to do so. Surprisingly, we look at the performance of stocks from companies like Amazon or Tesla and rarely … Read more
- Protect your savings with Gold ETFsDo you want to know why you should consider different ways to protect your money — such as gold ETFs or other precious metal ETFs? In this article, we give you the answer. Today we’re going to talk about something that directly affects your wallet. Because let’s be honest — … Read more


Technical Analysis
- Center of Gravity Indicator (COG) of John EhlersTechnical analysis offers traders numerous tools to decode market movements, and among the lesser-known but highly effective indicators is the Center of Gravity (COG). This unique oscillator, developed by renowned engineer and trader John Ehlers, brings a fresh perspective to momentum analysis by applying principles from physics to financial markets. … Read more
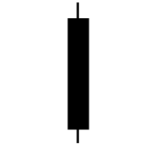
- Long Black Candlestick PatternThe Big Black Candlestick is a confirmation pattern for downtrends and is noted for having a high reliability. Itis characterized by open near the maximum and close near the minimum, with a much larger real body than other Black Candlesticks that usually occur in the price charts. Because of this, to identify … Read more
- Woodie’s Pivot Points – Definition and FormulasPivot points are a valuable tool for traders as they allow the calculation of support and resistance levels that can be used as a reference point to develop an entire methodology or approach to trading in the market. Another popular method for calculating pivot points is Woodie’s Pivot Points, which … Read more
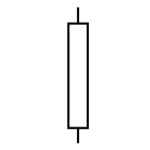
- Long White Candlestick PatternThe Long White Candle candlestick pattern appears opening near the minimum and closing very near the maximum of the market session. Its figure is much larger than those produced by the normal White Candles that are formed in price charts. Therefore to differentiate the two candles the trader should analyze … Read more
- Oscillator of a Moving Average (OsMA) – Main FeaturesThe OsMA (Moving Average of Oscillator) is a technical analysis indicator that measures the difference between an oscillator (usually the MACD) and its signal line (usually a moving average of the MACD). The traditional OsMA is usually derived from the MACD (Moving Average Convergence Divergence) indicator, which is itself a … Read more
- Klinger oscillator in trading: how to take advantage of this indicator?The Klinger oscillator in trading is one of many technical indicators used to find buying and selling opportunities in financial markets. The Klinger oscillator is unique in that it takes into account both price and volume data in its calculation. The theory behind the indicator is that strong price movements … Read more