- The opening price and closing price are equal or nearly equal.
- In a classic Doji the upper and lower tail are relatively short and equal or nearly equal.

Doji Candlestick Pattern Features and Interpretation
There are actually several types of Doji, as the Long Ledgged Doji, which will be analyzed in other articles on the subject, but in this section we deal only with the classic Doji. This is a fairly common candlestick pattern that can be found under different market conditions, including including range markets and trend markets.
If a Doji is formed in a trading range (a market with no clear trend), it will have no relevance so it should not be taken into account. However, if it is formed in a market with a strong trend and in its most advanced stage, we must pay close attention to this pattern. For example, if during a pronounced upward trend a Doji occurs after a large white candle, this may be a sign that the trend is running out. Conversely, if this pattern is formed after a big black candle in a pronounced downward trend, this is also a sign of a possible exhaustion of the trend.
The Doji Candlestick Pattern is a candle that indicates indecision in the market, where there is a balance or draw of power between buyers and sellers so there is no prevailing price movement in one direction or another.
Despite this, this candlestick should not be used alone as a trading signal to open positions in the market. In this case, it is advisable to wait for confirmation during the next session once the following candlestick has been completely formed as the Doji can occur in the middle of a market trend and therefore may constitute only a temporary stop in the current trend. In some cases these temporary stops are the starting point of strong moves in the direction of the prevailing trend. The Japanese call this as “The market has cooled.”
An important consideration is how to really know whether or not we are really seeing a Doji especially when we have a candlestick with an opening and closing price not exactly equal. In this case, it is recommendable to analize the previous candlestick of the period that is being studied. If there are many candlesticks of this type in the chart with similar closures and openings it is best not to consider them as Doji.
Another important aspect with respect to these candlesticks is that like in the other formations based on Japanese Candlesticks, in the limits of their tails will form the respective tops and bottoms, or in other words resistances and supports according to the tendency. This means that in a bullish trend a Doji candlestick pattern will always be a resistance and in a bearish trend will always be a support.
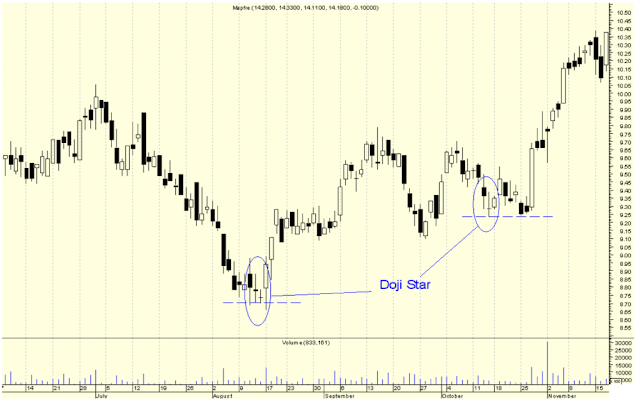
Example of Doji
I am Raúl Canessa, the founder of Forexdominion.com. As an experienced Forex trader, my passion for investing and algorithmic trading has shaped my professional journey. Over the years, I have dedicated myself to refining my skills in the financial markets, allowing me to share my knowledge and insights through my platform. I am committed to helping others understand the world of trading and develop effective strategies for success in this exciting field.
 Indicator")


 - Main Features")

