This is a simple trading system that looks for overbought and oversold conditions in the price to enter the market, so it works best in non-trending markets, but still offers the ability to build an equity curve that grows positively and constant.
It is based on the use of two-oscillator indicators, the RSI and the Chande oscillator, which are quite well known and are used in many systems to detect overbought and oversold conditions, especially in ranging markets. Both oscillators are price momentum indicators used to determine whether the market momentum is predominantly bullish or bearish.
It was initially developed to trade the Forex market in time frames of 15 minutes or more, however, it can also be used in other markets.
As always, it is recommended to test this trading methodology on a demo account before using it for real money trading.
Settings and indicators of the trading system
- Recommended markets: This system can be used in any financial market, including Forex, precious metals, indices, and even stocks.
- Recommended Time Frames: It was developed to trade on time frames from 15 minutes (M15) and up.
- Recommended market sessions: The system can be used in any market period. However, it should be kept in mind that the Australian and Asian market sessions present little volatility and less opportunity to take profits.
- System indicators:
- One 9-period Relative Strength Index (RSI 9)
- One Chande oscillator of 13 periods (CMO 13)
Chande momentum oscillator
This is a price momentum technical indicator invented by technical analyst Tushar Chande. It calculates the difference between the sum of all recent gains and the sum of all recent losses and then divides the result by the sum of all price movements during the period. It is similar to other momentum indicators such as the RSI and Stochastic Oscillator in that it is limited by a range (+100 and -100).
The formula for calculating the Chande momentum oscillator is as follows:
CMO = 100 x ((Su – Sd) / (Su + Sd))
Where:
Su = Sum of price differences in bullish periods.
Sd = Sum of price differences in bearish periods.
Trading Strategy Rules
As we will see later, the rules for opening and closing positions in this system are quite simple. It is a mechanical trading system in which the positions opening occurs when the indicators generate certain signals that are detailed below:
Buy positions
The opening of a bullish position occurs when the system indicators present the following conditions:
- The RSI must be below the 30 level.
- The Chande Momentum Oscillator should be below -50.
Sell positions
The opening of a bearish position occurs when the system indicators present the following conditions:
- The RSI must be above the 70 level.
- Chande’s momentum oscillator should be above the +50 level.
Closing open positions
Stop Losses – Depending on the time frame used to trade with this system, the following stop losses are recommended:
- M15 Time Frame: 20 pips above or below the last swing high or low.
- M30 Time Frame: 25 pips above or below the last swing high or low.
- H1 Time Frame: 30 pips above or below the last swing high or low.
- H4 Time Frame: 60 to 80 pips above or below the last swing high or low.
- Daily Time Frame (D1): 100 to 120 pips above or below the last swing high or low.
Take profit – Depends on the currency pair, volatility and time frame we are trading:
- M15 time frame: 20 to 30 pips from the entry point.
- M30 time frame: 30 to 50 pips from the entry point.
- H1 time frame: 50 to 70 pips from the entry point.
- H4 time frame: 80 to 120 pips from the entry point.
- Daily time frame (D1): 150 to 250 pips from the entry point.
This trading system does not work well in trending markets. Therefore, although it is not essential, the use of a filter for ranging markets is recommended. For example, ADX is a trend strength indicator, which can be used to determine whether the market is trending strongly, or moving in a price range without a defined trend.
For this, we can also use the modified Corona SNR indicator, which was developed specifically for the Metatrader 4 platform. It is not essential to use this indicator to trade with this system, but it can improve your trading signals since it serves as a trend filter, so we only execute the signals where the market presents ranging conditions.
If this filter is used, the potential trades that present the previous signals are taken into account only when the Corona SNR indicator is greater than 6.
You can download this indicator at the following link:
Example of the trading system
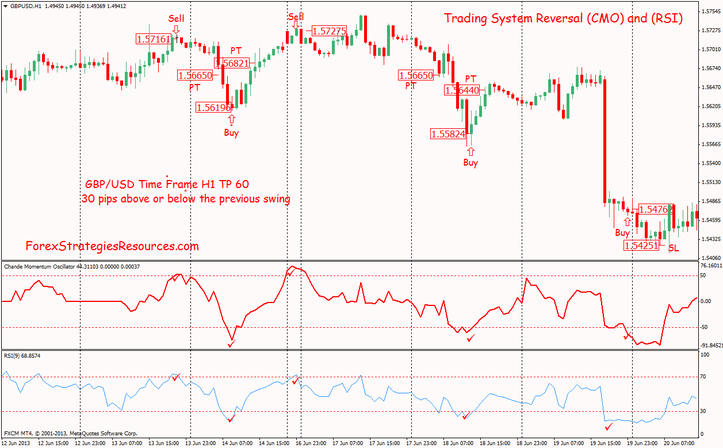
In the image above, we have an H1 price chart of the GBP/USD currency pair where there are several examples of trading signals generated with this system. In total, we have three buy signals and two sell signals. In 3 of the trades the price reached the profit target, while in the other two signals there were trades that ended in loss and reached the stop loss.
In long trades, we can see how the RSI and the Chande oscillator were in oversold conditions, while in short trades, both oscillators were in overbought conditions. These types of signals provided by these oscillators can lead to profitable trades when the market is moving in a defined range with no trend. In trending markets, the overbought and oversold conditions of momentum oscillators like the RSI can lead to many false signals and losing trades, as the latest signal generated by the system demonstrates. This is because a market that is in a strong uptrend or downtrend can remain overbought or oversold for an extended period of time.
As we can see, the best trading signals in this example occurred precisely when the market was moving in a range (the first, second and fourth signals).
I am Raúl Canessa, the founder of Forexdominion.com. As an experienced Forex trader, my passion for investing and algorithmic trading has shaped my professional journey. Over the years, I have dedicated myself to refining my skills in the financial markets, allowing me to share my knowledge and insights through my platform. I am committed to helping others understand the world of trading and develop effective strategies for success in this exciting field.
 - Definition and Signals")
 Indicator")


 - Main Features")