Inverted Head and Shoulders – An Overview
- Rates falling down to trough and further rising up.
- Rates dropping down than the earlier trough and further climbing up.
- At last, the rates dropping down once again but not so bad like the 2nd trough.
The main features of the Inverted Head and Shoulders
- The inverted head and shoulders pattern appears when the market is in a downtrend, and indicates that there is a high probability of exhaustion of the selling impulse at the market.
- Once the formation is complete this implies a bullish corrective phase, which means a change in the trend from bullish to bearish trend.
- It is a pattern that can be seen very often in the market indicating reversal phases, therefore it is recommended that the trader pay attention to it.
- As the head and shoulders pattern, this formation has a high level of reliability, ie the trader can use this figure with some confidence as an indicator of a possible change in trend.
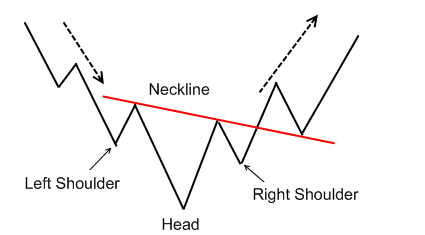
The inverted head and shoulders pattern is also called as reverse head and shoulders as it is the opposite of this formation. When examining the chart, the shift beyond the resistance is called as neckline and it is more likely utilized as a signal for moving higher. Professional traders will closely observe for a huge spike for sustaining the effect of the breakout. This chart pattern is quite adverse to the head and shoulders pattern and it is commonly implemented to guess the changes in the downtrend.
Basically this chart pattern will take place after a long downtrend during the bottom formation. The left shoulder formation is quite greater than the head formation, sustaining the rate goes with lesser intensity standard. The head and shoulders inverted chart pattern should comply an extensive downtrend in rates. Negligible increase in the rates are described and related with trend line that might slope towards up, where the trend line is described as neckline here. Also the inverted head and shoulders must be implemented when dealing with lighter volume, whereby the price will further rally up.
Example of the Inverted Head and Shoulders pattern

I am Raúl Canessa, the founder of Forexdominion.com. As an experienced Forex trader, my passion for investing and algorithmic trading has shaped my professional journey. Over the years, I have dedicated myself to refining my skills in the financial markets, allowing me to share my knowledge and insights through my platform. I am committed to helping others understand the world of trading and develop effective strategies for success in this exciting field.


 Indicator")