One of the hardest things with respect to trading (if not the most difficult) is to control one’s emotions. There are countless books written about technical analysis and study of chart patterns, and of course these issues are important, but for most traders emotions are the most difficult thing to master. Mechanical systems which have specific entry and exit rules, as the system presented in this article, take the emotions out of the game and reduce the difficulties associated with emotions in trading.
Introduction to the trading system based on Renko charts
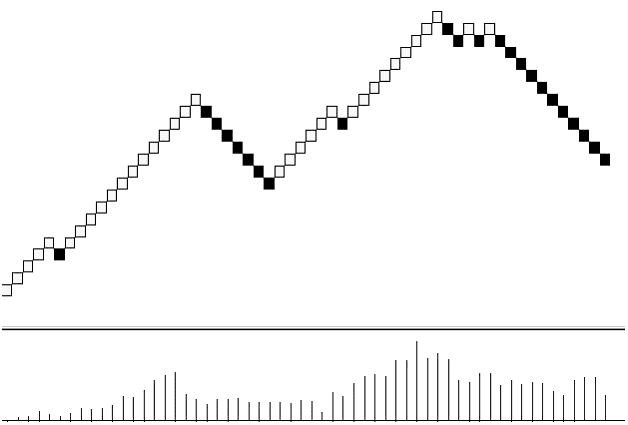
As indicated above, the Renko charts are quite effective to clearly define support and resistance levels and also ignored much of the “noise” that normally accompanies traditional price charts. However, Renko charts can also be subject to noise, and in order to mitigate this market noise, you can use a number of indicators to generate reliable buy and sell trading signals.
A set of indicators that can be used are:
- Exponential Moving Average (EMA) of 7 periods.
- Stochastic oscillator with the following settings: 14, 3, 3.
- Parabolic SAR with the following settings: 0.09, 0.2
- A MACD histogram can also be used with a 5-period EMA to find divergences.
Trading System Rules
The buy/sell signal occurs when there is a color change on the Renko chart signaling a possible change in the trend:
- Buy signal: Bricks on Renko chart change color from dark to white (a possible change from bearish to bullish trend).
- Sell signal: Bricks on Renko chart change color from white to dark (a possible change from bullish to bearish trend).
In order to confirm and ensure the signals reliability (to eliminate the signals produced by market noise) we use the following filters:
- EMA (7 periods): the price (Renko chart bricks) must be above (long position) or below (short position) of this moving average. By itself this is not a buy/sell signal but rather a guide, unless combined with other indicators.
- Stochastic Oscillator (14, 3, 3): This technical indicator used with this configuration works quite well through the crossings. The buy/sell signals generated with the Renko chart has to be confirmed with the stochastic oscillator as follows:
- Buy signal: The stochastic has to cross the level 20 from below.
- Sell Signal: The stochastic has to cross the level 80 from above.
- Parabolic SAR: The buy/sell signals from the Renko chart must match the Parabolic SAR signals for greater reliability.
- Buy signal: The Parabolic SAR should be below the price, indicating that the market has an upward trend.
- Sell signal: The Parabolic SAR should be above the price, indicating that the market is bearish.
An MACD histogram with a 5-period EMA can be used to find price divergences, which can also generate good buy/sell signals.
If we put all these rules together, we have that the buy/sell signals from the Renko chart are confirmed by matching signals of the Parabolic SAR, crosses of levels 20 and 80 of the stochastic oscillator and the bullish/bearish cross of the EMA 7 with the price. This combination eliminates many of the false signals.
Trading systems based on Renko charts as the one presented above are good to get most of a trend while limiting losses which are kept to a minimum. Like any system sometimes it produces false signals, but these signals are more than compensated when we capture a strong trend.
Example of the Trading System

I am Raúl Canessa, the founder of Forexdominion.com. As an experienced Forex trader, my passion for investing and algorithmic trading has shaped my professional journey. Over the years, I have dedicated myself to refining my skills in the financial markets, allowing me to share my knowledge and insights through my platform. I am committed to helping others understand the world of trading and develop effective strategies for success in this exciting field.


