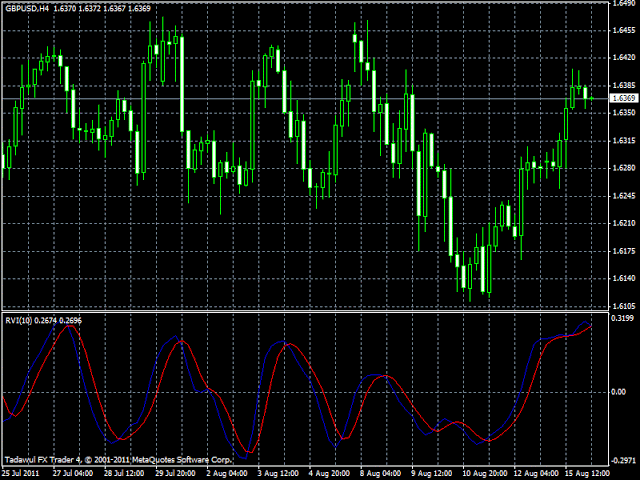
The Relative Vigor Index or RVI is a technical indicator used to measure the strength or conviction or a recent price action and the possibility of this movement to continue. This indicator was first described in the magazine TechnicalAnalysis of Stocks and Commodities in an article titled “Something Old, Something New – Relative Vigor Index (RVI)” by John Ehlers. Basically the RVI combines old concepts of technical analysis with modern theory of digital signal processing and filters so that it is an indicator that is both useful and practical.
- To normalize this index for trading day, divide the price change by the maximum of the price range of the day.
- For a more smoothed calculation of the RSV we use simple moving averages.
- A value of 10 periods is the best number to avoid ambiguity when is created a line called the Signal Line. This line is constructed based on 4 symmetrical periods.
- The intersection of the RSV and the Line Signal produces entry and exit signals.
Calculation formula
Relative Vigor Index (1) = (Close – Open) / (High – Low)
Relative Vigor Index (10) = 10-period SMA of Relative Vigor Index (1)
The RVI indicator is calculated as the current price change for a certain time period divided by the maximum range of price changes in that period. In order to reduce the dependence on strong price fluctuations, the averaging is applied according to the algorithm of SMA (Simple Moving Average) with 10 periods.
Example

Interpretation of the Relative Vigor Index
- In general, the higher the value of the indicator, the greater the acceleration of the price growth.
- The lower the value of the indicator, the greater the acceleration of the price fall. The Relative Vigor Index is a singular indicator.


