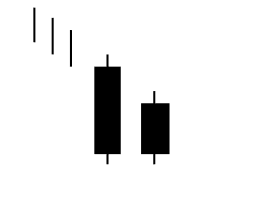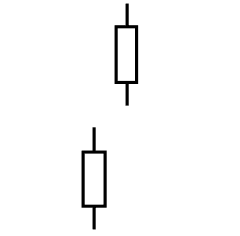
List of the most well-known Japanese candlestick patterns used by traders from a variety of financial markets, including Forex, stocks, commodities, and others. These patterns are grouped according to their reliability.
The principles of technical analysis can be traced to the mid-17th century when Japanese farmers used charts to track the price of rice. Later, in the mid-18th century, these farmers began the use of candlestick charts, specifically shortly after 1850. The development of this important tool of analysis of prices is credited to Munehisa Homma, a rice trader from Sakata.
Currently, the candlestick chart is one of the most widely used tools for market analysis worldwide thanks to its easy interpretation and the large amount of information that it presents which can be used to study any financial market including the Forex. It also facilitates the interpretation of more or less reliable chart patterns which are used by many traders as trading signals to open and close positions.
The candlestick patterns can provide the trader with invaluable information on the price action with a simple glance. While common candlestick formations can provide important data about what is “thinking” the market, they can sometimes generate false signals precisely because they are frequent. Therefore, it is also important to know the more advanced patterns which have a high degree of reliability and their use in combination with other market analysis tools. As with any other resource of technical analysis, the candlestick patterns should be used with other analysis tools to confirm their signals.


