
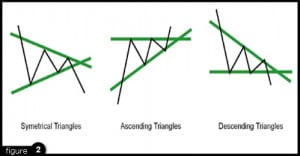
The Descending triangle is a trend continuation chart pattern which usually happens in bear markets while the sellers give pressure to the buyers for holding the orders in the market. Basically, the market rate tends to go up and it gets eventually confined by means of support level. When the rates are usually higher, then the descending patterns will be introduced and the market value will break in order to ensue with the downtrend. This formation is very similar to the Ascending Triangle but reverse.
Chart Patterns
Diamond Reversal Chart Pattern
Diamonds Chart Patterns Explained
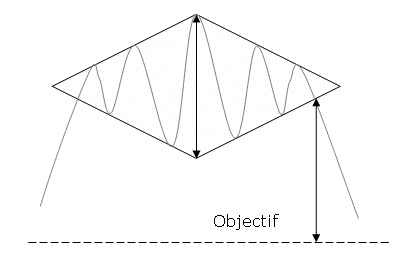
The diamond chart pattern is a very rare and exceptional form of chart formation which looks same like the head and shoulder or an inverted head and shoulder pattern. It is a reversal pattern which appears in a V shape. The diamond patterns will not frequently occur in the market bottoms and it usually takes place during the major top. As these diamonds chart pattern executes as a variant of head and shoulders chart patterns, the traders have to withstand their desire for differentiating the top that resembles a diamond formation. The basic reason for avoiding this pattern is that, the diamonds chart pattern will evoke a break in the trend very sooner when compared to the head and shoulders chart formation.
Basically there are two types of diamond patterns: the diamond bottoms which are formed in bearish trends and the diamond tops which are formed in bullish trends. In both cases the pattern is formed by two juxtaposed symmetrical triangles.
Trading Psychology and Trading Patterns – when the usdjpy broke the 100 level

Trading with price charts in the currency markets implies looking for repetitive shapes that happened in the past and by the time current price is making a shape like that traders have an educated guess about the possible outcome. This is what is known as a price pattern.
So looking for patterns when trading is one of the things that traders have in common as this helps forecasting price for the next period, depending very much on the time frame the pattern is being identified. If, for example, a head and shoulders pattern is identified on the weekly or monthly chart, then the measured move for it implies quite a strong move price will make.
When patterns are being used in combination with market psychology, the analysis becomes even more complex. It gives the trader a competitive advantage as, on one side, the pattern represents something from the past that can be projected into the future and on the other side market psychology comes to confirm/infirm that specific move.
Flag Chart Pattern – Identification, features and trading method
What are Flags patterns?
Flags are chart patterns which occur mainly during the consolidation periods, particularly while the market exists in a tight range. When it comes to flag formation, it has both optimistic and pessimistic interpretation. But this relies upon the currency pair´s trend existing in the market. When the Forex market (or any other financial market) goes up, the bullish flag (descending flag) tends to move downwards and when the market moves down, the bearish flag (ascending flag) will move upwards. Remember, flags and pennants are closely connected and have an extension pattern that will represent a pause over the market dynamics.
These chart patterns are most usually observed after a huge and intense move in the market trends. With a breakthrough in the market, there will be a usual uptrend/downtrend in the market following the same direction. Many potential resources and case study have stated that, the flag chart pattern has proven to be one of the most reliable formations in the charts market analysis.
Ascending Triangle Chart Pattern

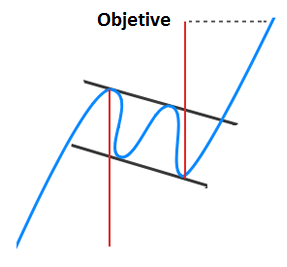
The Ascending triangle is a common chart pattern that is used in making market technical analysis and consists of a clear shape with 2 trend lines. This formation is used by many traders that operate regularly in financial markets like Forex. When it comes to ascending triangle, 1 trend lines is set horizontally which prevents the rate from going higher whereas the 2nd trend line joins the increasing trough series. Investors march forward to take over the long positions while the rates break towards the high resistance.
As the ascending triangle is usually deliberated as a continuation chart pattern, it is found during the consolidation period during the uptrend. When the breakthrough happens, buyers keep sending the rates insistently for the assets with higher value and probably they will be of higher volume as well. The pricing objective is usually fixed to the entry rate complementing the vertical height in the triangle.
Symmetrical Triangle Chart Pattern
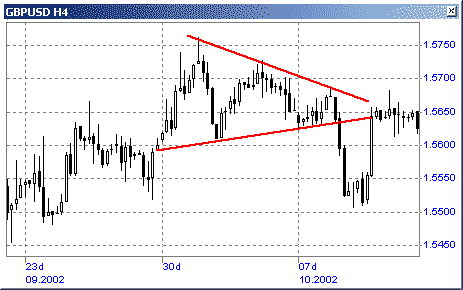
The Symmetrical Triangle is a chart formation that is also addressed as a coil and it is generally formed while the trend occurs as a continuation pattern. This pattern incorporates 2 lower highs and 2 higher lows. While the points get connected, then it forms a Symmetrical triangle by means of line coverage. Moreover the connectors remain wide in the start and it gets narrowed down at last. Although it is a trend continuation pattern, many reports have shown the importance of symmetrical triangle and even they play a dominant role in the trend reversals. They result with a continuation with the present market trend. Never mind whether it is reversal or continuation, the succeeding moves could be fairly discovered by means of a potential breakout.
Generally, price action within the triangle is usually identified by zigzag movements of three waves. This is better understood if one observes the following example:
Chart Patterns Formations in Trading
Financial markets, including Forex, involves plenty of chart formations, while not all of them are effective. There are many pricing patterns available and some of them give an excellent profit while a few of them doesn’t work good. First and the foremost, the chart patterns must focus on double top pattern and it is the common criteria used to grab the best accuracy. With a possibility to grasp 78% result, trading becomes simple and effective.
Inverted Head and Shoulders Chart Pattern
Inverted Head and Shoulders – An Overview
Inverted Head and Shoulders chart pattern is most commonly used in performing technical analysis for guessing the present downtrend in the Forex market. Basically, the head and shoulders inverted chart is distinguished while the security rate encounters the following attributes:
- Rates falling down to trough and further rising up.
- Rates dropping down than the earlier trough and further climbing up.
- At last, the rates dropping down once again but not so bad like the 2nd trough.
When the final trough reaches, the rate heads up across the resistance at the top of the earlier troughs. Traders enroll for a long time position, while the rate rises beyond the resistance. The 1st and the 3rd trough are described as the shoulders, while the 2nd peak signifies the head.
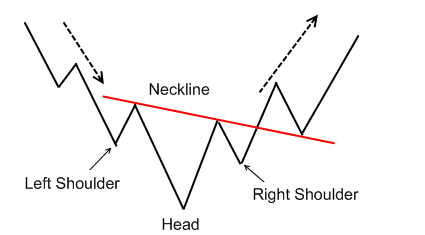
Head and Shoulders Chart Pattern

Description of the Head and shoulders
Head and shoulders is one of the promising and reliable chart patterns that are most likely used for both expert Forex traders and beginner traders with little experience in the market. There are plenty of charting patterns found in the forex market, but the head and shoulder pattern reflects the synopsis of the human being. Hence it is described as head and shoulder charting pattern. Novice traders will find this charting pattern quite difficult, but practice will make a man perfect. With little proficiency, the traders could distinguish this pattern visibly.
Like every other similar pattern, the head and shoulder pattern is framed with 3 rallies where the rally in the middle remains the highest known as the head flanked with 2 small rallies known as the shoulders. This formations is the opposite of the head and shoulders inverted.
Trading system with 1-2-3 pattern and Bollinger Bands

In this article we will explain a trading strategy that combines the use of Bollinger Bands and the 1-2-3 pattern, a very powerful chart pattern used by many traders in a variety of markets. It is a simple strategy as we shall see below, however, it requires mastery of a number of theoretical concepts that we will explain below.
The 1-2-3 maximum that originate in the upper bollinger band or moving average line (center line of the Bollinger Bands) and the 1-2-3 minimum which originate in the lower bollinger band or the moving average line, provide excellent signals that indicate possible changes of direction in the market. Because the 1-2-3 pattern occurs in virtually every market and any time frame, this strategy can be applied to trade in a variety of instruments and time frames, including short, medium and long term.