For years, the interest of numerous market scholars has focused on W.D. Gann, the architect of very successful market predictions. Eager for knowledge, a plethora of speculators have tried to find out how Gann was able to obtain such a level of precision, making such wise market predictions. For example, in number two of the fifth volume of the magazine Ticker and Investment Digest (December 1909), it is mentioned that Gann carried out 286 trades in the presence of William E. Gilley, of which 264 were successful. Therefore, his win ratio reached a spectacular 92%. In that 25-day period covered by the article, Gann was able to double his starting capital ten times.
Among Gann’s many speculative techniques, perhaps the most famous is the one known as the Square of Nine, one of his most mysterious calculations and trading systems.
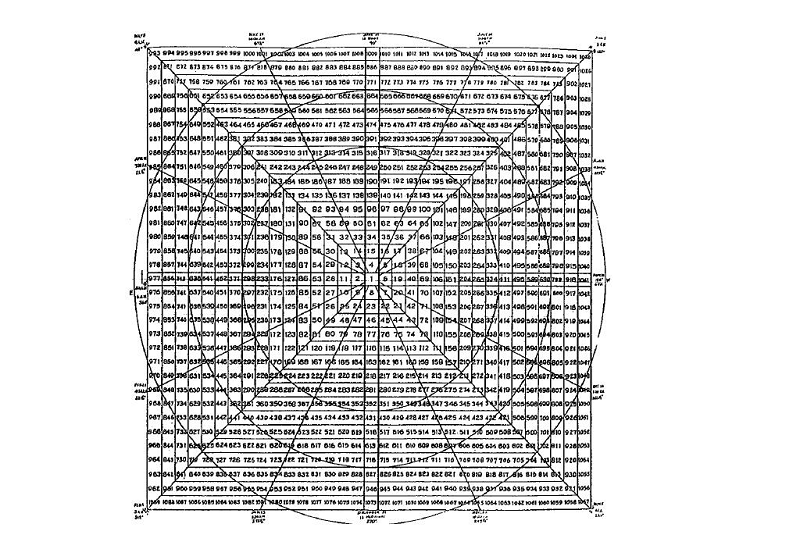
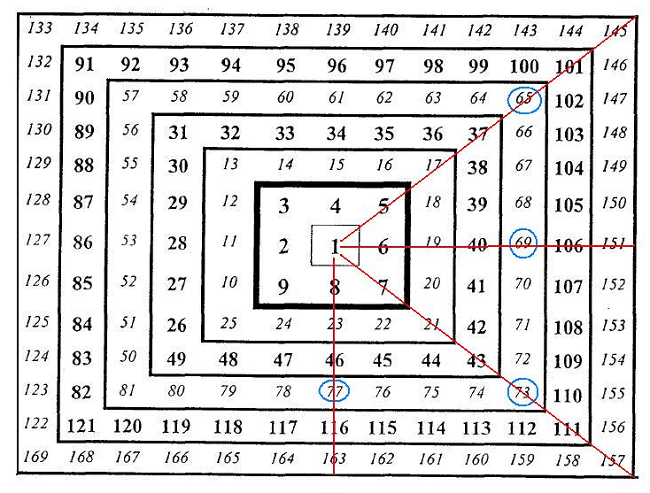
According to some acquaintances of Gann, he was wearing a miniature Square of the Nine when he came to speculate on the stock exchange floors. Gann believed that each minimum and maximum in a price chart bears a mathematical and temporal correlation with minimums and maximums from the past. He held that nothing in nature is moved by chance and that mathematical principles are found in the creation of everything we know. That the universe, in short, is a compendium of mathematical points of force. Below is what the Gann Square of 9 looks like
There is something in this strange wheel that intrigues everyone who sees it, be it a market enthusiast or a layman in the matter. The true origin of the Square of Nine is unknown. Gann is believed to have discovered it in India or Egypt, in the course of his painstaking inquiry into the ins and outs of numbers. My guess is that the Square of Nine’s most likely origin dates back to Egypt. In fact, the Temple of Luxor incorporates it into its architecture. However, listening to the greatest experts in Gann, the Square would only be a representation of the Great Pyramid of Giza seen from a zenith shot.
No doubt, for Gann the number 9 treasured a precious value. In some of his texts, he wrote that we use nine numbers to measure everything and that we cannot go beyond 9 without starting again at zero. In fact, the number nine has some unique characteristics when added to or multiplied by any number.
If you add 9 to any number, the resulting number will be reduced by adding the initial one-digit number. For example 1 + 9 = 10; 1 + 0 = 1. Another example: 2 + 9 = 11; 1 + 1 = 2. A third example: 3 + 9 = 12; 1 + 2 = 3.
If the number 9 is multiplied by any other number, the resulting product will be reduced to 9 by addition. An example: 9 × 5 = 45; 4 + 5 = 9. Another example: 9 × 8 = 72; 7 + 2 = 9. A third example: 9 × 33 = 297; 2 + 9 + 7 = 18; 1 + 8 = 9
Also the sum of all the digits from 1 to 9 is reduced by addition to the number 9. Let’s check it: 1 + 2 + 3 + 4 + 5 + 6 + 7 + 8 + 9 = 45; 4 + 5 = 9.
This is why Gann said that number nine measured everything.
What is the Square of Nine?
In essence, it is a tool to forecast Time and Space, to measure them in different ways.
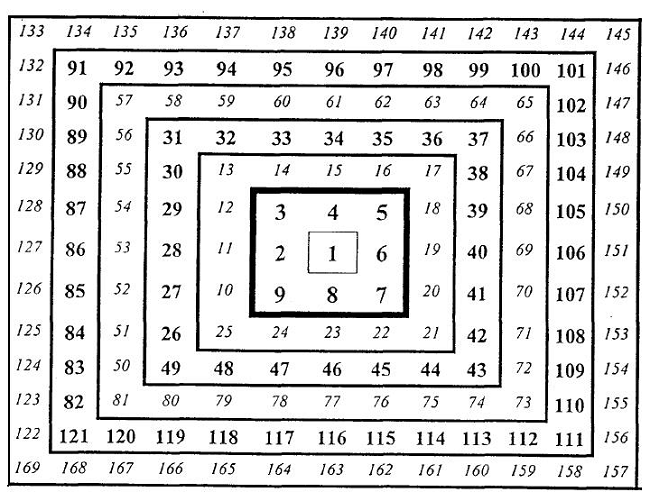
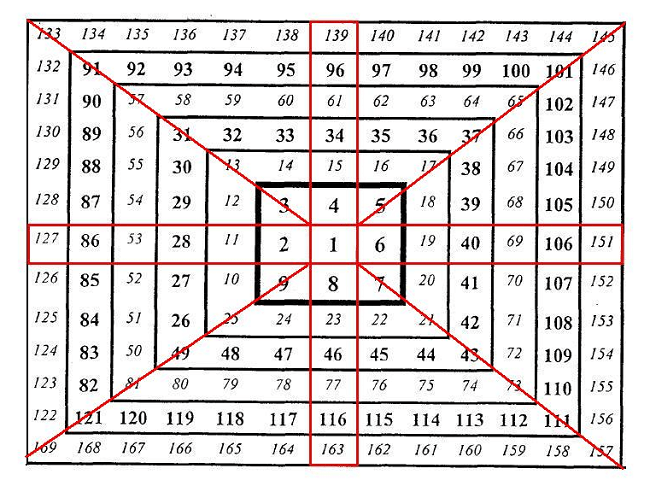
It is obvious that this Square is a numerical structure arranged in a spiral shape that begins with number 1 in the center and number 2 on the left. The rest of the numbers move around 1 clockwise until they reach number 9, at which point the first cycle of numbers around the center is completed. From number 10 to 25 the second cycle is completed; from 26 to 49, the third; etc.
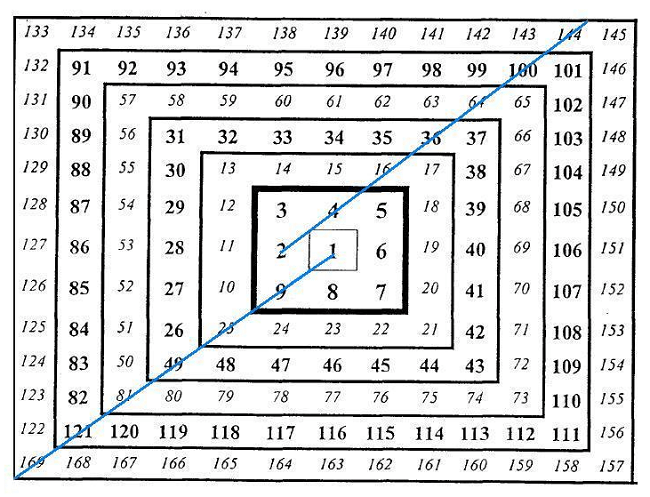
The diagonal in the direction of the lower left corner is formed by the square of the odd numbers (1, 9, 25, 49, 81, 121, 169 …). The parallel diagonal that goes towards the upper right corner is formed by the square of the even numbers (2, 4, 16, 36, 64, 100, 144 …).
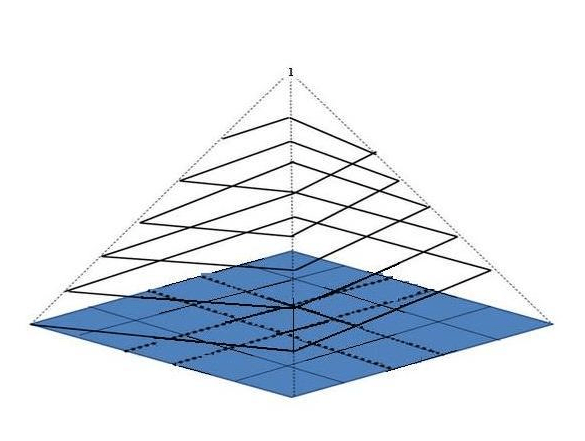
To appreciate the square in terms of its geometric origin, try to imagine it as a pyramid whose vertex was number 1 with four sides cascading down to the base of the pyramid.
In order to complete the Square, it must be surrounded by an external ring with the days of the calendar to fit the 365 days of the year in the 360º of the circumference formed by that ring.
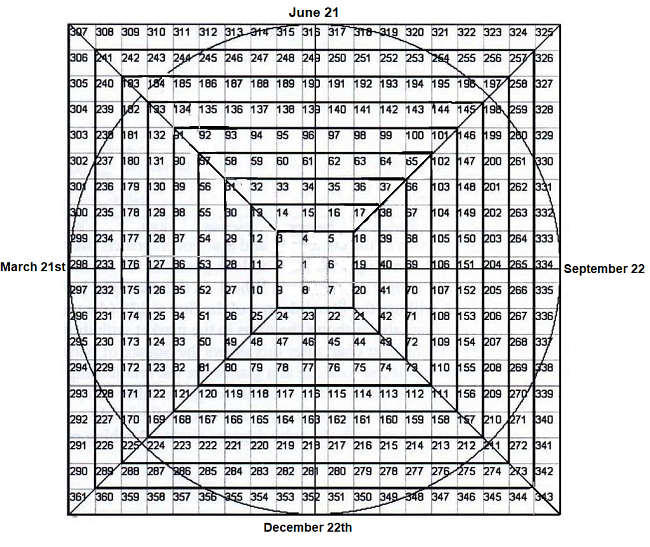
This relationship of the numbers with the circumference is explained by the fact that each number corresponds to a specific angle between 0º and 360º. Pythagoras stated that “the units in a circle or in a square are related to each other in terms of Space and Time at specific points”. Consequently, the Square of Nine is presented as an extremely fast tool for finding number blocks that have a geometric relationship with the past minimums and maximums on a price chart.
Gann wrote that “man began to measure time using a solar clock, dividing the day into 24 hours of 15º in length. The geometric reflection of the sun on the sundial indicated the time of day. Therefore, since time is measured by the Sun, we must use 360º of the circumference to measure Time in the markets ”.
Returning to the outer ring with the calendar days of the year, the zero point always starts on the first day of spring, between March 20-21.
To understand why the starting point is set precisely that day, it must be understood that the Square sinks its roots in the movement described by the Sun through its node. The node is the point in Earth’s orbit where the plane of the equator and the plane of the Sun intersect, generating the first day of spring. This nodal point is known as the equinox because the hours of the day and night have an equal duration. At the spring equinox, the Sun forms 90º with the Earth plane, an angle that generates intense electromagnetic radiation that significantly affects the life of all living beings.
After the spring equinox, in the northern hemisphere the sunlight increases until reaching its maximum on the first day of summer, June 20 or 21, at which time it forms 90º with the first day of spring. Sunlight then begins its decline until the days and nights equalize again on the first day of fall, September 22 or 23. From then on, the darkness gains ground until December 21 or 22, the first day of winter. These four points associated with the seasons are known in the Square of Nine as the cardinal cross.
Given this arrangement of the Square of 9, it is no coincidence that most of the highs and lows of the market occur around the numbers that make up that cross. Also of special importance to Gann were the numbers connecting the base of the pyramid, that is, the numbers that join the corners of the Square to form a cross. The essential division of the Square, therefore, consists of 8 parts of 45º each (1/8 of 360º). These eight number blocks house a special ability to balance Time and Space.
The philosophy that connects the Square of Nine with the movement of the Earth’s translation around the Sun is based on the fact that on March 21 the reincarnation of life occurs. Then, on the summer solstice, that new life that takes over animals, plants and insects is in a state of boiling.
Subsequently, once the autumnal equinox is reached, the maximum degree of vital fruition is left behind and the cycle of life decreases, deteriorating on its way to old age. On December 21st, on the winter solstice, life goes into a frozen state, with a view to re-emerge when the rays of sunlight brought by the spring equinox arrive.
Gann commented that “in the Bible it is clearly stated that there is a time and a season for everything that is under the Sun and that there are no exceptions to this cyclical norm. The Earth moves around the sun in 365 days. This completes the journey through 360º ”.
Examples of the Square of Nine in action
Since it is not the purpose of this article to offer a full course on the Square of Nine, but an introduction, we will leave the theoretical explanations here. Therefore, let’s go now with the practical application of this tool. But before looking at the following examples, I want to clarify that what we are going to show next constitutes a tiny sample of the many practical applications that the Square of Nine contains.
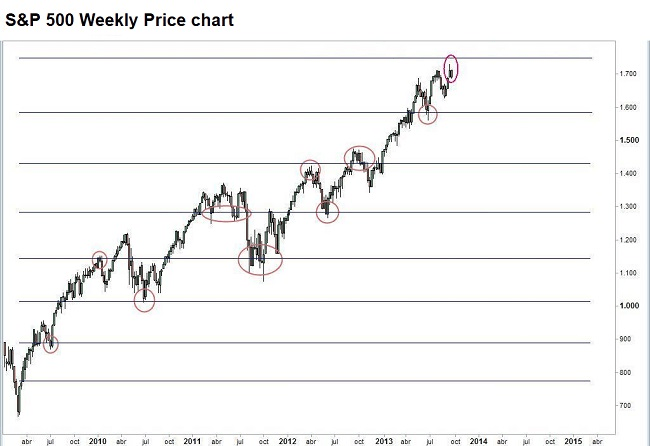
Having cleared this point, the Square of Nine, in the first instance, allows us to calculate targets for bullish and bearish movements of the price of any asset. The lines that I present in the following price chart, which I call Gann Lines, are born directly from the Square of Nine and serve as price objectives that alternately function as maximums and minimums. In this example, the S&P 500 has almost reached one of these lines, which will undoubtedly act as a strong resistance should the price catch up.
Regarding the time forecast, I present below a price chart in which thanks to the Square of Nine it was possible to calculate how often downward movements were to take place from the maximum in October 2007 to the minimum in March 2009, a price minimum that was perfectly predicted using this tool.
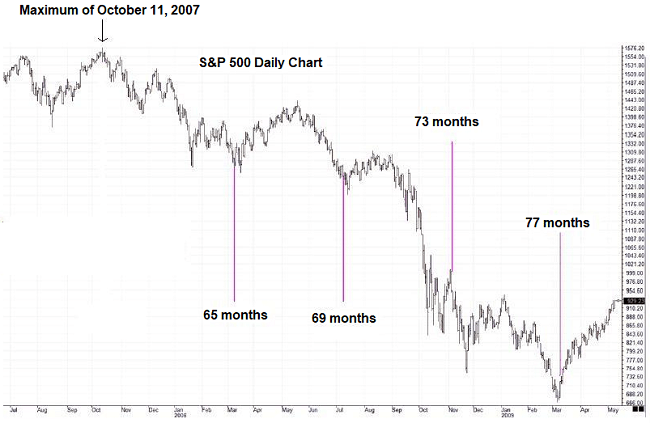
The point is that the exact number of each month that appears in the price chart is not random, but responds to the numbers arranged in the Square of Nine, specifically those that appear in the right horizontal area and in the lower vertical area of the cardinal cross and on the two diagonals on the right side of the Square. Logically, the key lies in knowing why it was those numbers and not others that dominated the market at that time.
The following example is from the most recent past. All the turning points that are marked were calculated with the Square of Nine having as a starting point March 21, that is, using the outer ring explained above.
In short, the Square of Nine is a wonderful instrument that allows the trader to forecast the Space and Time for any financial asset. Although its complex appearance may arouse the rejection of some people, I can assure that the study of its properties and its subsequent management are a first-rate intellectual stimulus.
Later we will explain in more detail how to trade with the Square of 9 and other Gann tools. For now you can get more information in the following PDF guide:
I am Raúl Canessa, the founder of Forexdominion.com. As an experienced Forex trader, my passion for investing and algorithmic trading has shaped my professional journey. Over the years, I have dedicated myself to refining my skills in the financial markets, allowing me to share my knowledge and insights through my platform. I am committed to helping others understand the world of trading and develop effective strategies for success in this exciting field.


