The difficult part to begin to trade in any market is to define the strategy or trading system that we are going to apply to make money, as there are many trading systems but:
- Which trading systems are really robust?
- What are the main features of robust trading system?
A robust trading system is a trading strategy that is designed to perform well under different market conditions and over long periods of time. A robust trading system is not overly sensitive to minor changes in the market or to specific market conditions, but rather has a built-in flexibility to adapt to changing market environments.
A robust trading system typically involves a combination of different trading strategies and risk management techniques that are tailored to the individual needs and objectives of the trader. The system should have clear rules for entering and exiting trades, as well as a well-defined risk management plan that includes strategies for managing drawdowns and minimizing losses.
A key characteristic of a robust system is that it has been thoroughly tested using historical market data to ensure that it has a high probability of success in the future. This testing should include multiple market scenarios and time periods to ensure that the trading system can perform consistently over a wide range of market conditions.
Overall, a robust system is designed to help traders achieve their trading goals while minimizing risk and maximizing long-term profitability. By having a well-designed and thoroughly tested trading system, traders can have confidence in their ability to navigate the markets and make informed trading decisions.
We can do a practical exercise to evaluate the robustness of two well-known trading strategies:
- Trading system based on moving averages: We buy when the short moving average (MA1 of the chart) surpasses the long moving average (MA2). We close this operation and we open the opposite trade (sale) when the short moving average (faster) goes below the long moving average (slower).
- Trading system based on maximum/minimum breakouts (Donchian channels): We buy when the price exceeds a certain maximum of “x” days and close the transaction when the minimum of “y” days is reached. For example, we can buy 1 lot when we reach the maximum of 80 days and close the transaction when we reach the minimum of the last 30 days.
In order to evaluate the robustness of both strategies we will be based on a study of 20 Forex pairs in the periods of 1993 to 2003 and 2003 to 2009. They are 20 years x 252 trading days x 21 currency pairs = 105,840 days of information. All of these multiplied by 1,600 tests of the possible values of the moving averages or maximum/minimum results in 169 million possible transactions.
It is a statistically significant sample. The results in generated profit values ($) are:
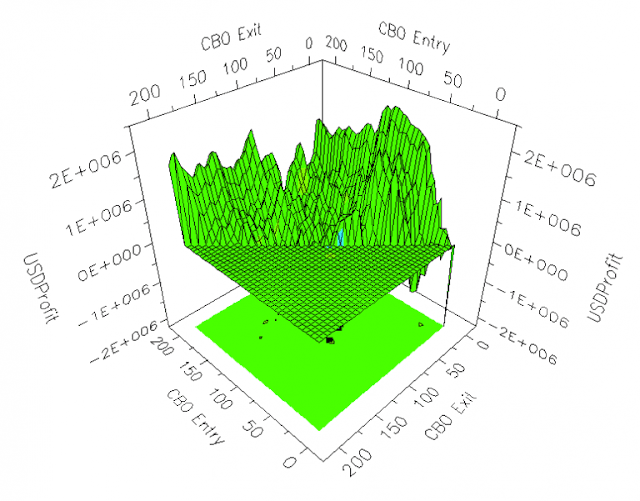
Moving averages system from 1993 to 2003:


The first conclusion we can draw from the above results is that some of the values of moving averages that worked very well during the years 1993 to 2003 were clearly losers from 2003 to 2009.
Now we analyze the results of the highs and lows breakout system from 1993 to 2003:

In the results of the maximum and minimum breakout system, the benefits achieved are not as high as those reached with some values in the moving average system during the 20 years of the study, but almost all combinations used in the system lead to long-term benefits.
In terms of profit factor, it is very rare that the maximum and minimum breakout system exceeds values greater than 1.2. However there have been combinations of moving averages that have produced values of profit factor of 2.5, but later those same values of the moving averages produces only losses.
If you know anything about gambling, you probably know that the casino’s advantage over the roulette players is two zeroes: 20/18 = 1.1111; where the casino wins with the black and with the two boxes with zeros. These are profit factor values very similar to those we achieve with the maximum and minimum breakout system, perhaps it is the constant (robust) advantage that you need to beat the market.
What indicators are used to assess the robustness of a trading system?
There are several indicators that can be used to assess the robustness of a trading system. Here are some common ones:
- Backtesting Results: Backtesting is the process of testing a trading system using historical market data to see how it would have performed in the past. A robust trading system should have positive and consistent backtesting results over multiple market scenarios and time periods.
- Drawdown Analysis: Drawdown refers to the peak-to-trough decline in account equity. A robust trading system should have a well-defined drawdown limit and should be able to recover from drawdowns quickly.
- Profit Factor: Profit factor is the ratio of gross profits to gross losses. A robust trading system should have a high profit factor, indicating that the system is making more money than it is losing.
- Risk-Adjusted Return: Risk-adjusted return measures the return of a trading system relative to its risk. A robust trading system should have a high risk-adjusted return, indicating that it is generating high returns while keeping risk low.
- Sensitivity Analysis: Sensitivity analysis involves testing a trading system under different market conditions and parameters. A robust trading system should be insensitive to small variations in parameters and should perform well under a wide range of market conditions.
- Out-of-Sample Testing: Out-of-sample testing involves testing a trading system on data that is not included in the initial backtesting period. A robust trading system should perform well on out-of-sample data, indicating that it is not overfit to the initial dataset.
Overall, assessing the robustness of a trading system requires a thorough analysis of its performance under different market conditions and scenarios. By using a combination of indicators, traders can gain a better understanding of the strengths and weaknesses of their trading system and make informed decisions about how to optimize it.
I am Raúl Canessa, the founder of Forexdominion.com. As an experienced Forex trader, my passion for investing and algorithmic trading has shaped my professional journey. Over the years, I have dedicated myself to refining my skills in the financial markets, allowing me to share my knowledge and insights through my platform. I am committed to helping others understand the world of trading and develop effective strategies for success in this exciting field.


