Technical analysis offers traders numerous tools to decode market movements, and among the lesser-known but highly effective indicators is the Center of Gravity (COG). This unique oscillator, developed by renowned engineer and trader John Ehlers, brings a fresh perspective to momentum analysis by applying principles from physics to financial markets.
What is the Center of Gravity Indicator?
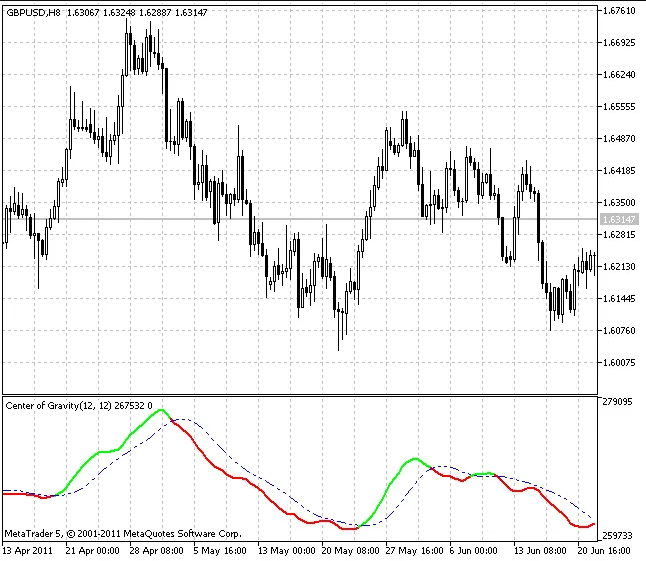
The Center of Gravity indicator is a momentum-based oscillator developed by the famous analyst and trader John Ehlers that identifies potential turning points in price action by calculating the center of gravity of recent price movements. Just as a physical object has a center of gravity around which it balances, price movements have a mathematical center of gravity that can reveal when momentum is shifting.
Unlike traditional oscillators that focus on overbought and oversold conditions, the COG indicator excels at pinpointing exact moments when price direction is likely to change. This makes it particularly valuable for swing traders and those looking to time their entries and exits with precision.
The Mathematics Behind COG
The Center of Gravity calculation applies a weighted average approach where recent prices carry more significance. The formula considers both price values and their positions within the lookback period, creating a weighted center point.
The basic calculation involves:
- Taking a specified number of periods (typically 8-14)
- Applying position weights to each price point
- Calculating the weighted average that represents the center of gravity
- Plotting the result as an oscillating line
The mathematical foundation ensures that the indicator responds quickly to price changes while filtering out minor fluctuations that might generate false signals.
Reading COG Signals
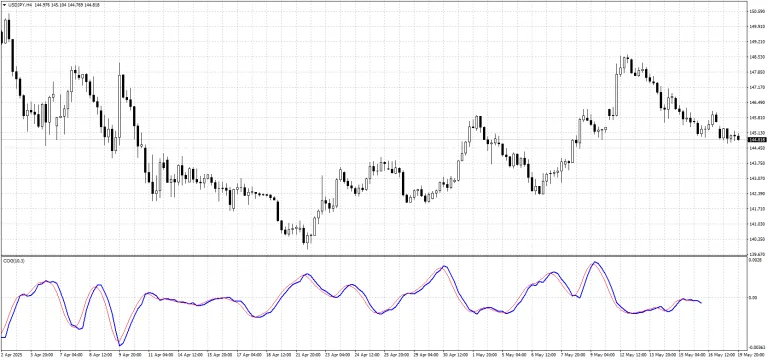
The Center of Gravity indicator generates signals through its oscillating movement around a zero line. When the COG line moves above zero, it suggests upward momentum, while movement below zero indicates downward pressure.
The real power of the COG lies in identifying turning points. When the indicator reaches extreme values and begins to reverse, it often precedes similar reversals in price action. These reversal points become prime opportunities for entering trades in the direction of the emerging trend.
Traders should pay particular attention to:
- Divergences: When price makes new highs or lows but COG fails to confirm
- Zero-line crosses: Movement above or below the center line
- Extreme readings: Values that reach unusually high or low levels
Practical Trading Strategies
Reversal Strategy
The most straightforward approach involves watching for COG extremes followed by reversals. When the indicator reaches its highest or lowest points in recent history and begins turning back toward zero, this often signals an impending price reversal.
Entry signals occur when:
- COG reaches extreme levels (above +1 or below -1)
- The indicator begins moving back toward zero
- Price action confirms with a reversal candlestick pattern
Momentum Confirmation
Traders can use COG to confirm momentum in trending markets. When price breaks to new highs and COG also reaches new extremes, this suggests strong underlying momentum that could continue.
Multiple Timeframe Analysis
Combining COG readings from different timeframes provides a more comprehensive market view. A bullish signal on both the daily and hourly COG indicators carries more weight than a single timeframe signal.
Optimization and Settings
The standard COG period setting ranges from 8 to 14, with 10 being the most commonly used value. Shorter periods make the indicator more sensitive but increase false signals, while longer periods provide smoother readings but may lag price action.
For different trading styles:
- Day traders: 8-10 period setting
- Swing traders: 10-14 period setting
- Position traders: 14-20 period setting
The indicator works effectively across various asset classes, including stocks, forex, commodities, and cryptocurrencies, though optimal settings may vary slightly between markets.
Strengths and Limitations
The COG indicator’s primary strength lies in its ability to identify turning points with remarkable accuracy. Its mathematical foundation based on weighted averages helps filter market noise while remaining responsive to genuine momentum shifts.
However, like all technical indicators, COG has limitations. In strongly trending markets, the indicator may remain at extreme levels for extended periods, potentially generating premature reversal signals. Additionally, during low-volatility periods, the indicator may produce minimal signals, leaving traders without clear direction.
The key to success with COG lies in combining it with other technical analysis tools rather than relying on it exclusively. Price action analysis, support and resistance levels, and trend identification should all complement COG signals.
Advanced Applications
Experienced traders often combine the Center of Gravity indicator with complementary tools to create robust trading systems. Popular combinations include:
- COG + Moving Averages: Using moving averages to determine overall trend direction while COG provides precise entry timing.
- COG + RSI: Combining momentum readings from both indicators to confirm signal strength.
- COG + Volume Analysis: Validating COG signals with volume patterns to ensure institutional participation.
Common Mistakes to Avoid
New users of the COG indicator often make several typical errors. Trading against the prevailing trend based solely on COG signals can lead to losses, as the indicator works best when aligned with the broader market direction.
Another common mistake involves over-optimization. While it’s tempting to adjust settings for maximum historical performance, this often leads to curve-fitting that fails in real-time trading.
Finally, ignoring risk management principles in favor of COG signals can be costly. The indicator should enhance, not replace, proper position sizing and stop-loss strategies.
Conclusion
The Center of Gravity indicator offers traders a unique perspective on market momentum and timing. Its mathematical foundation and focus on turning points make it a valuable addition to any technical analysis toolkit.
Success with COG requires understanding its strengths and limitations while integrating it thoughtfully with other analytical methods. When used correctly, this indicator can significantly improve entry and exit timing, leading to more profitable trading outcomes.
As with any technical tool, practice and experience are essential for mastering the COG indicator. Traders should spend time studying its behavior across different market conditions and timeframes before committing significant capital to COG-based strategies.
I am Raúl Canessa, the founder of Forexdominion.com. As an experienced Forex trader, my passion for investing and algorithmic trading has shaped my professional journey. Over the years, I have dedicated myself to refining my skills in the financial markets, allowing me to share my knowledge and insights through my platform. I am committed to helping others understand the world of trading and develop effective strategies for success in this exciting field.
 - Main Features")


 - Definition and Signals")
 Indicator")
