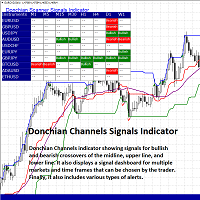
In this article, we will showcase a modified indicator for Metatrader 4 called Donchian Scanner Signals, designed to display signals from this technical analysis tool on any timeframe and instrument provided by the broker. This indicator operates by presenting Donchian channel bands along with the following types of trading signals:
- Bullish and bearish crossovers of the upper band, lower band, and middle band of the Donchian channels.
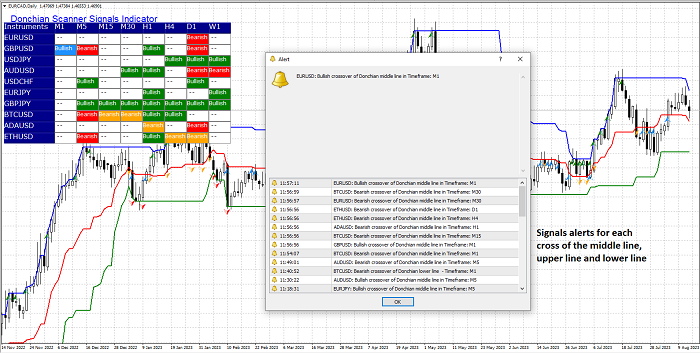
- A signal dashboard showcasing bullish and bearish crossovers of the Donchian channel lines across multiple markets and timeframes (ranging from M1 to MN) as selected by the trader.
- A window featuring real-time signal alerts.
Moreover, the indicator can notify the user through email, push notifications, and sound alerts, as illustrated in the configuration window below. In the following image, we can observe the signals displayed by the Donchian Scanner Signals indicator:
What are Donchian Channels?
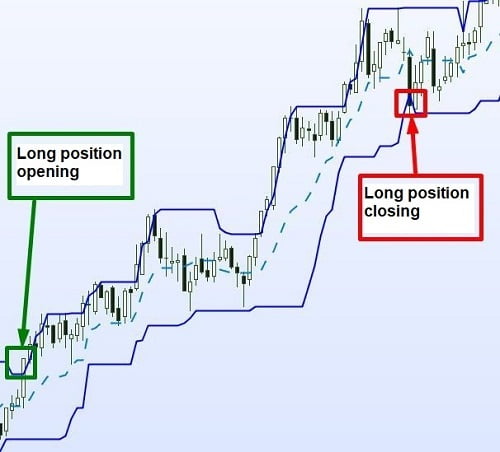
Donchian Channels are a technical analysis tool used in the fields of investment and trading. They were developed by futures trader Richard Donchian in the 1970s. These channels are used to visualize the price volatility of a financial asset and to identify potential entry and exit points in a trade. Donchian Channels are constructed by plotting three lines on a price chart:
- Upper line (highest of N periods): This line represents the highest price reached by the asset during a specific period of time, which is defined by the user according to their preference.
- Lower line (lowest of N periods): This line displays the lowest price reached by the asset during the same time period.
- Middle line (average of the upper and lower lines): This line is located at the midpoint between the upper and lower lines and can act as a reference level for determining the trend direction.
The idea behind Donchian Channels is that prices staying above the upper line may suggest an uptrend, while prices falling below the lower line may suggest a downtrend. Traders can look for buying opportunities when the price crosses above the upper line and selling opportunities when the price crosses below the lower line. Furthermore, these channels can also assist traders in setting stop-loss and take-profit levels. For instance, a strategy could involve placing a stop-loss below the lower line when buying or above the upper line when selling. That’s why, at ForexDominion, we have developed this tool that analyzes price action behavior and its trend using Donchian channels, applied to one or multiple instruments and timeframes.”
How does the Donchian Scanner Signals indicator work?
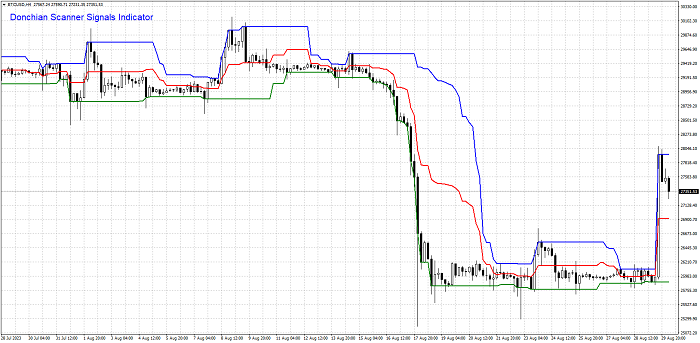
As we already explained, this indicator is designed to analyze the market trend behavior using Donchian channels across various instruments and timeframes. In its simplest form, the indicator only displays Donchian channels on a price chart without any additional signals. In this regard, it resembles any other similar Donchian indicator, as depicted in the following image:
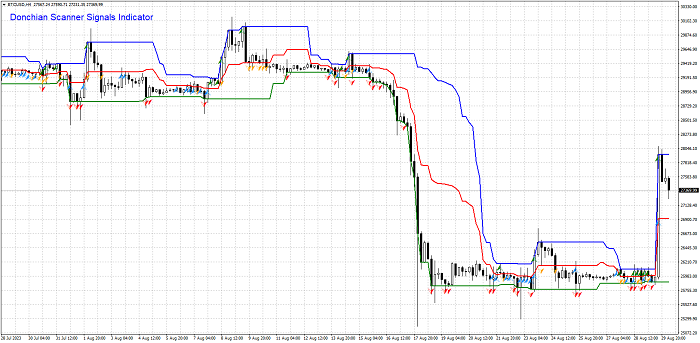
If the first type of signal is activated (Display Donchian channel signals), bullish and bearish arrows appear to indicate upward and downward crossovers of the Donchian channel lines:
- Green arrows indicate a bullish crossover of the upper line.
- Red arrows indicate a bearish crossover of the lower line.
- Cyan arrows indicate a bullish crossover of the middle line.
- Orange arrows indicate a bearish crossover of the middle line.
These signals apply only to the current chart.
If the signal dashboard is enabled, the trader can select instruments (as long as they are available with the broker) and timeframes (from one minute to one month) to visualize signals of bullish and bearish crossovers of any of the Donchian channel lines on any chosen instrument and timeframe, as illustrated in the following image:
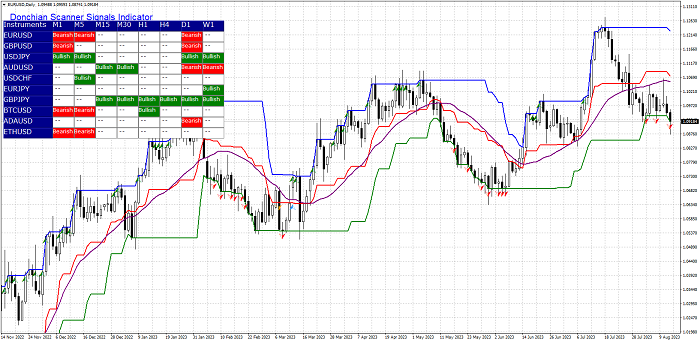
- The cells in green indicate a bullish crossover of the upper line.
- The cells in red indicate a bearish crossover of the lower line.
- The cells in cyan indicate a bullish crossover of the middle line.
- The cells in orange indicate a bearish crossover of the middle line.
This allows the trader to identify opportunities in any market without the need to have multiple charts open simultaneously loaded with indicators. Lastly, the indicator displays an alerts window that shows an alert every time the price crosses one of the Donchian channel lines on one of the chosen markets and timeframes. This window comes with a sound alert.

Furthermore, the indicator allows filtering Donchian channel signals through widely used and well-known indicators: a moving average, the stochastic oscillator, and the RSI. If the trader activates the signal filtering option, they can select the filter’s parameters (such as the period of the moving average). This way, the trading signals will appear (on the chart, on the signal dashboard, and in the alerts window) only if the signal aligns with the readings provided by the filters. For instance, only bullish crossovers of the upper line and middle line of the Donchian channel will be displayed if they occur above the selected moving average when the stochastic oscillator and RSI are above the 50 level. Finally, the user can also configure the indicator to send alerts through email, push notifications, and sound alerts.
Donchian Scanner Signals Indicator Settings
The following image displays the indicator’s configuration window:
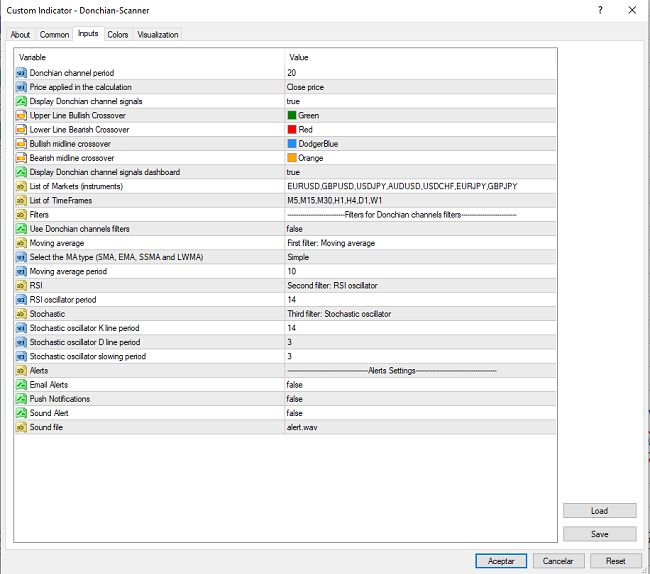
At the top of the window, we can specify the calculation period for the Donchian channels (the default value used is 20), the price type used to calculate the indicator, and the colors of the signal arrows for bullish and bearish crossovers of the different Donchian lines. The parameters that can be adjusted in the indicator are as follows:
- Donchian channel period (default value: 20): This parameter allows to indicate the number of periods used in the calculation of the Donchian channels
- Display Donchian channels signals (default value: false): With this parameter the trader indicates if he wants the indicator to show graphic signals where there were crosses of the channel lines.
- Upper Line Bullish Crossover (default value: green): It allows the trader to choose the color that marks the bullish crossovers of the upper line.
- Lower Line Bullish Crossover(default value: red): It allows the trader to choose the color that marks the bearish crossovers of the lower line.
- Bullish Middline Crossover (default value: skyblue): It allows the trader to choose the color that marks the bullish crossovers of the middle line.
- Bearish Middline Crossover (default value: orange): It allows the trader to choose the color that marks the bearish crossovers of the middle line.
- Display Donchian channel signals dashboard (default value: false): Here we choose if we want the indicator to show the signals dashboard.
- List of Markets (Instruments): Here the trader indicates the markets or currency pairs in which he wishes to calculate the Donchian channels values and its signals. You can add as many pairs as the broker offers on the platform. By default, the indicator shows EURUSD, GBPUSD, USDJPY, AUDUSD, USDCHF, EURJPY and GBPJPY pairs.
- List of Time Frames: In this parameter we can indicate in which time frames we want to calculate the Donchian channels and its signals for each currency pair. We can aggregate all the time frames that MT4 offers. By default, the indicator displays frames M5, M15, M30, H1, H4, D1 and W1.
- Use Donchian channels filters (default value: false): Through this parameter we can indicate if we want the signals to be filtered by indicators such as moving averages or the RSI.
- Select the MA Type (default value: Simple): For the first filter we can select the type of moving average (SMA, EMA, SMMA and LWMA)
- RSI Oscillator Period (default value: Simpe): It is the period of the RSI oscillator that is going to be used as a filter for the Donchian channel signals.
- Stochastic Oscillator Kline Period (Default value: 14): It allows to indicate the number of periods used in the calculation of the stochastic line.
- Stochastic Oscillator Dline Period (Default value: 3): This parameter allows to indicate the calculation period of the oscillator signal line.
- Stochastic oscillator slowing period (Default value: 3): This parameter controls the internal smoothing of the Kline line.
- Email Alerts: With this parameter the trader can activate the sending of signal alerts via email.
- Push Notifications: With this parameter we can activate signal push notifications on mobile devices.
- Sound Alerts: This parameter is to activate sound signal alerts.
Although this indicator has several parameters that can be modified, it is actually quite simple.”
Recommendations for Using the Donchian Scanner Signals Indicator
It is a well-established fact that no single technical indicator can be used as the sole criterion for opening and closing positions in any market, as Donchian channels, the technical tool upon which Donchian Scanner Signals is based, can also generate false signals, like any other market analysis tool. There are no infallible technical indicators. Even indicators developed using the most complex analysis algorithms and methods can produce false signals and lead to losses. Donchian channels are used in many trading systems as trend indicators and to confirm market breakout signals. They also help determine when a market is in a ranging phase.
As such, while they can be used to generate entry and exit signals on their own, it is recommended to use this indicator and its signals in conjunction with other technical analysis tools, as part of a well-crafted and tested trading methodology. On its own, the indicator can be used to trade in line with the trend when the channel lines show a clear upward or downward direction and/or when a breakout of one of these lines occurs. It can be combined with other tools, such as moving averages, Fibonacci retracements, etc.
How to Obtain the Donchian Scanner Signals Indicator?
The modified Donchian Scanner Signals indicator was created by ForexDominion developers and can be purchased for $40 USD through Paypal using the following form:
| Item to buy | 1 copy of the modified Donchian Scanner Signals indicator for Metatrader 4 in .ex4 format
|
| Unit price (USD) | $40 |
| Instructions | *By clicking on “Purchase” you will be redirected to the Paypal page to complete the payment. |
If you have any problems please contact admin@tecnicasdetrading.com with the payment details. You can also contact us at https://www.forexdominion.com/contact-us. | |
You can also purchase the indicator through the MQL5 market using the following link:
In the MQL5 market of Metatrader, we have released the English version of this indicator for sale, as it is a highly reliable and secure platform. Additionally, you can download a demo version there, which provides traders with the opportunity to test this tool for a period of time at no cost.
One of the main advantages of the MQL5 market for purchasing indicators and other tools is that it offers a secure option for both buyers and sellers, streamlining the transaction process and preventing any kind of fraud.
But if you prefer to acquire this tool directly, you can contact us at the following email: admin@tecnicasdetrading.com
Accepted payment methods are: Paypal, Skrill, Neteller, Airtm and Bitcoin. If the client wishes and it is feasible, alternative methods can also be used.
Are you interested in developing a custom technical indicator or Expert Advisor for MT4 or MT5?
If you’re interested in creating a custom technical indicator or Expert Advisor based on your own trading methodology or idea, but lack the time or expertise to do it yourself, we can take on the task for you quickly and at the best prices. You can reach out to us through: Contact Form

