Modified indicator for Metatrader 4 that displays bullish and bearish signals from the Stochastic RSI oscillator, which, as its name suggests, is based on the well-known Relative Strength Index (RSI). This indicator, called RSIEst Screener, also presents a screener or dashboard with Stochastic RSI signals for different markets and timeframes selected by the trader.
In its basic form, this tool shows a window below the price chart where the Stochastic RSI appears along with its signal line. Depending on the trader’s configuration, the indicator also offers the following:
- Arrows indicating bullish and bearish crosses of the Stochastic RSI at the 50 level.
- Arrows showing crosses when the Stochastic RSI exits the overbought and oversold zones.
- A signals dashboard indicating bullish and bearish crosses of the lines at the main levels of the Stochastic RSI in multiple markets and timeframes (from M1 to MN) selected by the trader.
- A window with real-time signal alerts.
Not only that, but the indicator can notify the trader via email, push messages, and sound alerts, as shown in the configuration window described below.
In the following image, we can see the signals displayed by the Stochastic RSI Signals Screener indicator:

You can find more information about the Stochastic RSI and its signals at: The Stochastic RSI Oscillator
At ForexDominion, we have developed this tool that measures market behavior and movements through the Stochastic RSI, applied to one or multiple instruments and timeframes.
We have also created another similar analysis tool based on the RSI oscillator, an RSI Signals screener that can also track multiple markets and timeframes. You can get more information at: RSI Signals Indicator for MT4
How does the RSIEst Screener indicator work?
As mentioned earlier, this tool was designed to analyze price action behavior through the Stochastic RSI and its signal line on various instruments and timeframes. In its basic form, the indicator only displays the Stochastic RSI below the price chart without any additional signals. In this sense, it appears like any other oscillator-type indicator, as shown in the following image:

In the event that overbought/oversold signals are triggered (Stochastic RSI Overbought/Oversold Signals) and level 50 crossover signals (Stochastic RSI SMA Level 50 Crossovers), bullish and bearish arrows appear indicating crossovers of important Stochastic RSI levels:
- Green arrows indicate a bullish crossover from the oversold level.
- Red arrows indicate a bearish crossover from the overbought level.
- Cyan arrows indicate a bullish crossover of the level 50.
- Orange arrows indicate a bearish crossover of the level 50.
These signals only apply to the current chart.

When the indicator is activated, a dashboard or signal screener also appears where the trader can select the markets (provided by the broker) and timeframes (from one minute to one month) in order to visualize the main Stochastic RSI signals, as shown in the following image:
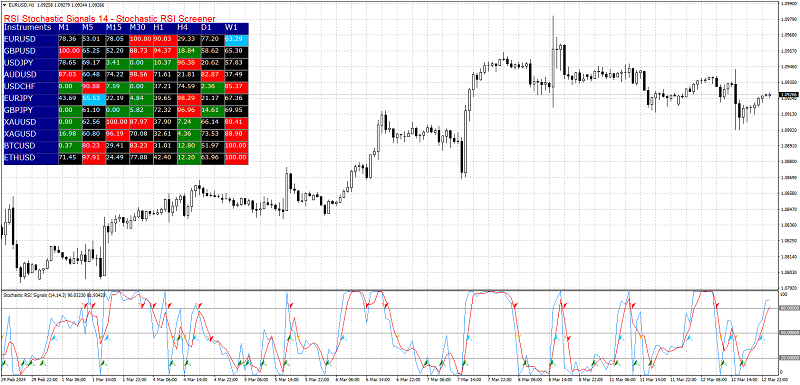
- The green cells indicate that the Stochastic RSI is in oversold conditions.
- The red cells indicate that the Stochastic RSI is in overbought conditions.
- The cyan cells indicate a bullish crossover of the signal line at level 50.
- The orange cells indicate a bearish crossover of the signal line at level 50.
The signal dashboard allows the trader to identify opportunities in any market without the need to open multiple price charts displaying the indicator.
Finally, the RSIEst Screener displays a signal alerts window indicating in which market and timeframe the Stochastic RSI exits oversold or overbought conditions and when the indicator’s signal line crosses above or below level 50. This window comes with a sound alert.

This tool is simple and easy to use. It also comes with a series of minor settings that we will describe later.
Configuration of the RSIEst Screener Indicator for MT4
The following image shows the indicator’s configuration window:
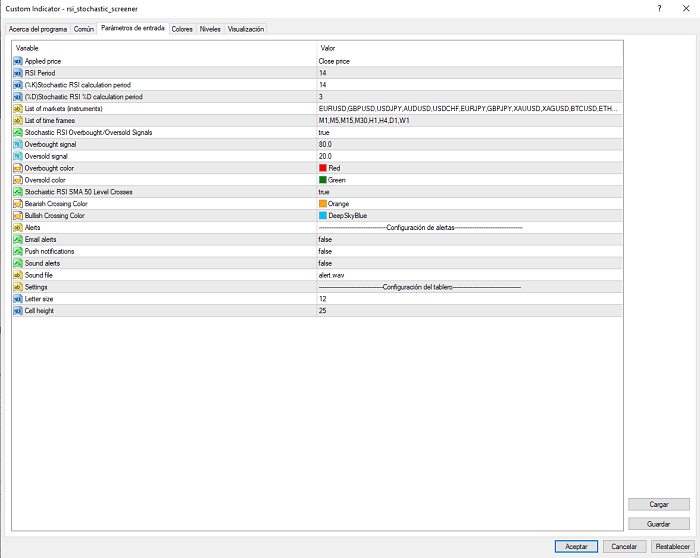
In the indicator’s configuration window, the user can modify multiple parameters such as the period used in the Stochastic RSI calculation, the price type, the period used for the Stochastic RSI calculation, overbought/oversold levels, and other minor aspects, such as the colors of the dashboard.
The parameters that can be changed in the indicator are as follows:
- Applied Price (Default: Close): This is the type of price used in the Stochastic RSI calculation. Other price types, such as open price, high price, or low price, can also be used.
- RSI Period (Default: 14): This is the number of periods used in the RSI calculation.
- (%K) Stochastic RSI Calculation Periods (Default: 14): This is the number of periods used in the Stochastic RSI calculation.
- (%D) Stochastic RSI %D Calculation Periods (Default: 3): This indicates the number of periods for the signal line of the Stochastic RSI, essentially an SMA of the Stochastic.
- Market List (Instruments): This is the list of currency pairs or other instruments that the trader wants to analyze using the indicator. As many pairs as offered by the broker on the platform can be added. The indicator defaults to showing the pairs EURUSD, GBPUSD, USDJPY, AUDUSD, USDCHF, EURJPY, and GBPJPY.
- Timeframe List: This is the list of timeframes where the trader wants to calculate the Stochastic RSI and its trading signals for each currency pair. All timeframes offered by MT4 can be added here. The indicator defaults to showing frames with M5, M15, M30, H1, H4, D1, and W1.
- Stochastic RSI Overbought/Oversold Signals: This parameter indicates whether to visualize signals when the Stochastic RSI is in overbought/oversold conditions.
- Overbought Level (Default: 80): This is the threshold where the Stochastic RSI reaches overbought conditions.
- Oversold Level (Default: 20): This is the threshold where the Stochastic RSI reaches oversold conditions.
- Overbought Color (Default: red): This is the color of the cell when the oscillator is in overbought conditions.
- Oversold Color (Default: green): This is the color of the cell when the oscillator is in oversold conditions.
- Stochastic RSI SMA Level 50 Crossovers: This parameter indicates whether to visualize signals when the Stochastic RSI crosses above or below level 50.
- Bearish Crossover Color (Default: orange): This is the color of the cell when the oscillator crosses below level 50.
- Bullish Crossover Color (Default: cyan): This is the color of the cell when the oscillator crosses above level 50.
- Email Alerts (Default: false): This is to activate the sending of signal alerts via email.
- Push Notifications (Default: false): This parameter is to activate push notifications of signal alerts on mobile devices.
- Sound Alerts: This is to activate sound alerts for signal alerts.
While this tool has many parameters that can be modified, it is, in reality, quite straightforward.
Recommendations for Using this Indicator
No technical indicator has been created so far that can be used as a unique analysis tool for trading (opening and closing positions), and the Stochastic RSI, the technical indicator on which the RSIEst Screener is based, can also generate false signals, like any other market analysis tool. In the case of this oscillator, it should be considered that it is more volatile than the traditional RSI and can rise or fall more easily.
The fact is that there are no fail-proof technical indicators. Even indicators developed with the most complex algorithms and analysis methods can produce false signals and result in losses.
The Stochastic RSI is used in some trading systems as a trend indicator and to show when the market is overbought/oversold. It tends to perform better in ranging markets. Although it can be used to generate entry and exit signals on its own, it is advisable to use this indicator and its signals along with other technical analysis tools as part of a well-developed and tested trading strategy.
For example, it can be combined with other tools such as moving averages, Fibonacci retracements, etc.
How can we obtain the RSIEst Screener indicator?
The modified technical indicator RSIEst Screener was created by developers at Trading Techniques and can be acquired for $35 USD through Paypal using the following form:
| Item to buy | 1 copy of the modified RSIEst Screener Indicator for Metatrader 4 in .ex4 format |
| Unit price (USD) | $35 |
| Instructions | *By clicking on “Purchase” you will be redirected to the Paypal page to complete the payment. |
| If you have any problems please contact admin@tecnicasdetrading.com with the payment details. You can also contact us at https://www.forexdominion.com/contact-us. | |
If you prefer to buy this tool directly, you can contact us at the following email: admin@tecnicasdetrading.com
Accepted payment methods include: Paypal, Skrill, Neteller, Airtm, and Bitcoin. If the customer wishes and it is feasible, alternative methods can also be used.
Do you need a custom technical indicator or Expert Advisor for MT4 or MT5?
If you are interested in creating a custom technical indicator or Expert Advisor based on your own trading methodology or idea but do not have the time or knowledge to do it yourself, we can do the task for you quickly and at the best prices.
You can contact us through: Contact Form
I am Raúl Canessa, the founder of Forexdominion.com. As an experienced Forex trader, my passion for investing and algorithmic trading has shaped my professional journey. Over the years, I have dedicated myself to refining my skills in the financial markets, allowing me to share my knowledge and insights through my platform. I am committed to helping others understand the world of trading and develop effective strategies for success in this exciting field.


 Indicator")
