In Forex trading we have at our disposal all kinds of trading tools and strategies, with which we can take advantage of the available capital and obtain a better return.
In this article we are going to explain a trading methodology that is based on the analysis of multiple time frames simultaneously, for trading in favor of the largest trends and find the best entry points.
It is slightly more complex than other methods, since it involves observing at least three time frames at the same time before entering the market: short, medium and long term.
Why is it important to use a trading strategy?
Forex can be extremely profitable but it is a complex speculation environment. If we add leverage and the fact that it is a margin instrument, the chances of losing money are also high.
To invest successfully it is important that you focus on the learning phase, and that you practice as much as possible. So try the trading tools at your fingertips and start developing effective trading strategies right now.
Be in no doubt that having a good strategy can make a difference, so plan your goals very well, and when you are sure of how to act, you can begin your career in the markets with confidence.
Do not worry, because if your strategy is good you will not have any problem to get the returns you expect, as long as you use it responsibly
Given that there are so many strategies created for Forex trading, it is important that you set your investment objectives and that you choose a system that can benefit you, helping you achieve the returns you expect with minimal risk.
And, precisely to help you, we will tell you that the possibility of trading with different timeframes is an advantage of Forex trading that you should not miss, since there are strategies that will allow you to trade multiple time frames with very favorable results for you.
Let’s see in more detail what this methodology consists of at a general level, but first, let’s define what time frames are.
What are time frames?
Before looking at what this trading strategy consists of, let’s define what time frames are, a concept that you must understand if you are going to use this methodology.
A time frame is an interval of time that begins at a certain moment and ends at another, in which something may or may not occur.
Time frames are like parallel realities of price. The price and its movements can be analyzed in annual, monthly, weekly, daily, hourly charts … thus until reaching tick charts.
When opening a price chart, in addition to the currency pair whose price we are going to analyze we have to select the time period associated with those prices. The time period chosen for the study would be the time frame of the analysis.
When we are looking at a price chart, we can establish patterns and trends, which occur in the period analyzed, but which may not correspond to the price at other different times.
This discrepancy between price and time may be our ally or our biggest mistake.
Different time frames, different trends and technical patterns
When we look at a Japanese candlestick or a price bar, we will have a series of information that is identical regardless of the time frame we use: opening, closing, maximum and minimum price.
If we observe the analyzed price bar at closing, we will not really know what happened during the analyzed time.We will only have that information, if we observe the same bar in a different time frame.
The bar may have ended at highs or lows, but thanks to a move at the last moment.
Does that change the analyzed bar something? Well no, the information is exactly the same “in this time period”, but the information will be completely different in a lower or higher time frame.

How can we use price discrepancies to our advantage?
Technical analysts use discrepancies in price movements, caused by different time frames, to make sound investment decisions.
The first thing we have to do so as not to get complicated and confused is to determine trading time period.
What does this mean? Well, if I like to make trades on daily charts, that will be my trading time frame, and I will only use the upper or lower time frames to define the trend or adjust my market entry.
Trade for or against the trend
Traders can trade in any direction, they can open buy or sell positions, also if the trend is bullish they can open buy positions in favor of this trend or sell against the trend or vice versa when the trend is bearish.
Which form of trading is more likely to succeed? Both, as long as we know what we’re playing at.
If I trade in favor of the “main” trend, my chances of success are usually higher, but as long as the time frames: weekly (higher) and daily (my trading time frame) are aligned.
But I can uncover a bearish price pattern on daily charts, while the long-term trend is bullish.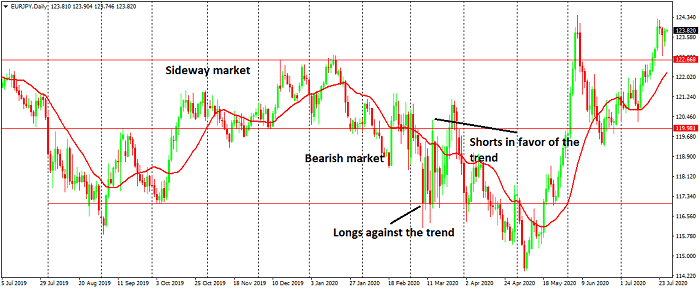
Should we trade this pattern or not? We could, but a trader will have to look at the weekly chart and decide if the trend is running out, or it can just start moving sideways.
What you can expect “against trend” is for the price to move “just a few pips” as the main trend remains bullish.
We shouldn’t be looking for a weekly trend change, on a daily price chart.
When these situations occur, the price will most likely stop rising (in an uptrend), but to produce a lateral or consolidation movement.
Defining the trend in a higher time frame
Following a little the thread of the article and with the daily example, our upper time frame in which we must define the trend is weekly.
How can we define the trend?
There are two ways to define the trend:
- With technical indicators: MACD, RSI, moving averages, etc.
- Price patterns: Observing the sequence of minimums and maximums.
The trend with technical indicators
The trend following technical indicators are very useful to help us make decisions.
When we have a moving average with a positive slope and the price above, the trend is upward. If the price is below the moving average and also changes its orientation, we will be in a downtrend.
In the case of the MACD, when the indicator is above its zero line, the trend is considered to be bullish, while when it falls below the zero line, the trend is negative.
With the RSI, it is considered a positive or negative trend, when its line crosses above or below its 50 level.
Analysis of the trend with the price
Sometimes we can discover a MACD that goes into negative terrain or a moving average that changes its slope, becomes bearish or shows a flat direction, without the price just going up or down.
They are the lateral, consolidation or distribution movements.
In these cases it is best to focus on price action: It is the price forming higher highs or lower lows?
If the price has just risen (or fallen) at the same point, without the minimum breaking previous lows or without breaking previous highs, we will be in a lateral movement and we should not use trend following systems.
A good idea to trade would be to get long at the bottom of the range, and short at the top of the range, until the price decides to continue with the previous trend or change its trend.
To get a little more guidance, if the previous trend is bearish we will look for shorts in the upper part of the price range and we will close positions in the lower part of range and vice versa, in this way we increase the chances of success.
Elder Triple Screen Trading System
Elder’s Triple Screen System uses the concept of different time frames to enter the market.
We can find the recommendation to use different time frames for trading purposes in different books and websites, but it is Elder who refined the concept and managed to formulate a very simple, but effective system.
- According to the triple screen trading system, we will take a time frame that will be the one used for trading, such as the daily time frame.
- Then we will use another time frame in which we will define the trend, in this case the weekly one.
- Finally we will use a third screen, which will serve to enter the market with a buy stop or sell stop.
Ideally, if you want to transform this system into another temporality, Elder recommends that the screens have a temporal relation of 5. One week (1 weekly candlestick) contains 5 days.
Once the trend is defined on a weekly chart, we will expect the price to move against it on daily charts.
The third screen, the one that provides the signal, is not really a graph, but a buy stop or sell stop (as defined by Elder).
For example, if we detect an uptrend on a weekly chart, but the price starts to fall back on the daily charts, we will start by putting a buy stop above the candle of the previous day.
We will enter the market when the daily trend changes and is oriented again with the weekly trend.
If the price continues to drop, we will continue to lower our stop and if the trend changes definitively, we will withdraw the order.
I think it is a basic and effective system with a very simple idea that works, although it can be improved.
I usually only use two screens: daily and weekly charts, trading in favor of the trend, when I discover interesting price patterns.
I can also trade against the main trend as long as it is aligned with the market.
As you may have deduced from this article, what we seek is to refine our decision-making, to make the least amount of mistakes.
If we focus on a single time frame, we will surely enter into many contradictory trades, which will cause us many losses.
I am Raúl Canessa, the founder of Forexdominion.com. As an experienced Forex trader, my passion for investing and algorithmic trading has shaped my professional journey. Over the years, I have dedicated myself to refining my skills in the financial markets, allowing me to share my knowledge and insights through my platform. I am committed to helping others understand the world of trading and develop effective strategies for success in this exciting field.


