The Relative Strength Index (RSI) oscillator is a technical analysis tool that is used to measure the strength and momentum of a financial asset, such as a stock or a currency pair. It was developed by J. Welles Wilder Jr. in 1978 and is widely used by traders and investors. It is one of the most popular and helpful oscillators used in technical analysis. Their values are obtained by comparing the gains against the losses of previous sessions (14 is the period recommended by Wilder).
The RSI oscillator ranges from 0 to 100, with readings above 70 indicating an overbought condition and readings below 30 indicating an oversold condition. Traders and investors use these levels to identify potential buying or selling opportunities.
The RSI oscillator is often used in conjunction with other technical analysis tools, such as moving averages and trend lines, to help confirm signals and identify potential trading opportunities.
History of the RSI oscillator
The Relative Strength Index (RSI) was developed by J. Welles Wilder Jr. and first introduced in his book “New Concepts in Technical Trading Systems” in 1978. Wilder was a mechanical engineer and trader who became interested in the stock market and technical analysis in the 1950s. He went on to develop a number of technical indicators, including the Average True Range (ATR) and the Parabolic SAR.
The original RSI formula used a 14-day period to calculate the average gains and losses. Wilder recommended using the RSI in conjunction with other technical analysis tools, such as trend lines and moving averages, to confirm signals and identify potential trading opportunities.
Since its introduction, the RSI has become one of the most widely used and popular technical indicators. It has been incorporated into many trading platforms and is used by traders and investors around the world to help identify potential buy and sell signals. Despite its popularity, the RSI, like all technical indicators, is not infallible and should be used in conjunction with other tools and analysis to make informed trading decisions.
RSI Calculation and Formula
The Relative Strength Index (RSI) oscillator is calculated using the following formula:
RSI = 100 – (100 / (1 + RS))
Where RS is the average of the gains and losses over a specified time period, usually 14 days.
To calculate the RSI, follow these steps:
- Determine the time period: Choose the time period for which you want to calculate the RSI. The default time period is 14 days, but you can use any time period that suits your trading style and preferences.
- Calculate the average gain and loss: For each day in the time period, calculate the price change (gain or loss) from the previous day. If the price increased, it’s a gain, and if it decreased, it’s a loss. Take the absolute value of the loss. Calculate the average gain and average loss over the time period by summing up the gains and losses and dividing by the number of days in the period.
- Average Gain = Sum of Gains over the period/Number of periods
- Average Loss = Sum of Losses over the period/Number of periods
- Calculate the Relative Strength (RS): Divide the average gain by the average loss to get the relative strength.
- RS = Average Gain / Average Loss
- Calculate the RSI: Use the RS in the RSI formula to calculate the oscillator.
- RSI = 100 – (100 / (1 + RS))
The resulting RSI value will be a number between 0 and 100.
As with the Average True Range (ATR), an indicator also developed by Wilder, the calculation is sensitive to the amount of historical data that we have because, as shown in the formula, the first data is not calculated in the same way as the following. The first calculation of the RS is a simple average of the total gains or losses while the following calculations are made using the previous average. This is the smoothing technique used by Wilder in almost all indicators developed by him.
From the formula of RS is deducted that when the average gain is greater than the average loss, the value of RSI will increase because the division profit/loss is greater than 1, while the RSI will decrease in the opposite case as the result of the division is less 1.
Once the RS is calculated, the RSI is obtained by converting the result to a scale of 0 – 100. It should be noted here that in case of loss becomes zero RSI is 100 by definition.
RSI main signals and uses
The Relative Strength Index (RSI) oscillator is a popular technical analysis tool that can provide traders with several trading signals and uses. Here are some of the main trading signals and uses of the RSI:
Overbought and oversold conditions
The RSI provides traders with clear signals of overbought and oversold conditions.
Wilder recommended the use of levels 70 and 30 as levels to detect overbought and oversold conditions. Generally, if the RSI rises above 30 from below is considered that the instrument is in an uptrend. On the contrary, the instrument will enter a downtrend if the RSI falls below 70 from above. This is because if the RSI is above 70 it says we are in an overbought market and if the RSI is below 30 it is said that the market is oversold. One tactic followed by many traders is to detect long-term trends and look at the RSI extremes to enter the market. For example, if the main trend is bearish and the RSI readings are above 70, that could provide good entry points into the market.
In the following price chart we show the overbought and oversold signals indicated by the RSI:
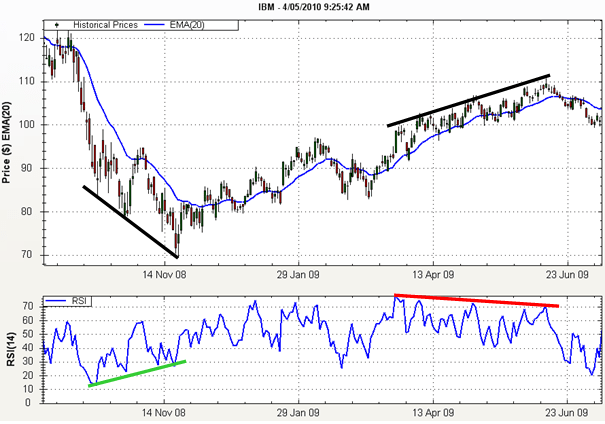
Divergences between price and RSI
As in many other oscillators, divergences, both positive and negative, between the RSI and price can generate buy and sell signals. Divergence occurs when the price of an asset moves in the opposite direction of the RSI. There are two basic types of divergence:
- Bullish Divergence: Bullish divergence occurs when the price is making lower lows while the RSI is making higher lows. It may signal a potential trend reversal and provide a buying opportunity. The bullish divergence is a very good sign to open a long position (buy).
- Bearish divergence: Bearish divergence occurs when the price is making higher highs while the RSI is making lower highs. It may signal a potential trend reversal and provide a selling opportunity. The bearish divergence is a very good signal to open a short position (sell).
The following, are two examples of RSI-price divergences:

Trend confirmation
Once the trend has been identified, traders can use the RSI to confirm the trend. In an uptrend, the RSI should generally stay above 50, and in a downtrend, the RSI should generally stay below 50. If the RSI is above 50 and rising, it may signal a bullish trend, and traders may consider buying. If the RSI is below 50 and falling, it may signal a bearish trend, and traders may consider selling.
Traders can also use other indicators to confirm the trend, such as moving averages or trend lines. For example, if the RSI is indicating a bullish trend, traders can look for a bullish crossover of a shorter-term moving average above a longer-term moving average to confirm the trend.
Measure momentum
The RSI can be used to measure momentum. A high RSI reading indicates strong bullish momentum, while a low RSI reading indicates strong bearish momentum. Traders can use this information to make trading decisions.
RSI main advantages and disadvantages
The Relative Strength Index (RSI) oscillator has several advantages and disadvantages that traders and investors should be aware of:
Advantages:
- Easy to use: The RSI is a simple and easy-to-use technical indicator that can be calculated using a few basic formulas. It can be incorporated into many trading platforms and charting tools.
- Provides signals of overbought and oversold conditions: The RSI provides traders with a clear indication of when a market is overbought or oversold, making it easier to identify potential turning points.
- Helps identify potential trend reversals: The RSI can be used to identify potential trend reversals and provide early signals of a potential change in direction.
- Can be used in conjunction with other technical indicators: The RSI can be used in combination with other technical indicators, such as moving averages and trend lines, to confirm signals and identify potential trading opportunities.
Disadvantages:
- Can generate false signals: Like all technical indicators, the RSI can generate false signals, particularly in volatile markets. Traders should use the RSI in conjunction with other analysis tools to confirm signals and avoid false signals.
- Lagging indicator: The RSI is a lagging indicator, which means it may not provide timely signals of a potential trend reversal. Traders should use the RSI in combination with other analysis tools to get a more complete picture of the market.
- May not work in all market conditions: The RSI may not work well in all market conditions, particularly in markets that are trending strongly in one direction. Traders should use the RSI in conjunction with other analysis tools to get a more complete picture of the market.
- Can be subjective: The RSI may be interpreted differently by different traders, leading to different trading decisions. Traders should use the RSI in conjunction with other analysis tools and their own judgment to make informed trading decisions.
What technical tools can be used with the RSI?
Traders often use the Relative Strength Index (RSI) oscillator in combination with other technical indicators to confirm signals and identify potential trading opportunities. Here are some of the most common indicators that are used with the RSI:
-Moving Averages: Moving averages are a popular trend-following indicator that can be used in combination with the RSI to confirm signals. For example, traders may use a moving average crossover to confirm a bullish or bearish signal generated by the RSI.
-Support and Resistance: Traders can use support and resistance levels to confirm signals generated by the RSI. For example, if the RSI is oversold and the price is approaching a key support level, it may be a good opportunity to buy.
-Trend Lines: Trend lines can be used to confirm signals generated by the RSI. For example, if the RSI is indicating a potential trend reversal, traders can look for a break of a trend line to confirm the reversal.
-Volume: Traders can use volume to confirm signals generated by the RSI. For example, if the RSI is indicating a potential trend reversal, traders can look for a spike in volume to confirm the reversal.
-Fibonacci Retracement: Fibonacci retracement levels can be used to identify potential support and resistance levels. The RSI can be used in combination with Fibonacci levels to confirm signals and identify potential trading opportunities.
It’s important to note that traders should not rely solely on the RSI or any other indicator to make trading decisions. It’s important to use a combination of analysis tools and strategies to make informed trading decisions.
More information on this useful technical indicator in the following article: RSI Indicator Guide for Traders
Conclusion
I am Raúl Canessa, the founder of Forexdominion.com. As an experienced Forex trader, my passion for investing and algorithmic trading has shaped my professional journey. Over the years, I have dedicated myself to refining my skills in the financial markets, allowing me to share my knowledge and insights through my platform. I am committed to helping others understand the world of trading and develop effective strategies for success in this exciting field.

 - Main Features")

 - Definition and Signals")

