Financial markets, including Forex, involves plenty of chart formations, while not all of them are effective. There are many pricing patterns available and some of them give an excellent profit while a few of them doesn’t work good. First and the foremost, the chart patterns must focus on double top pattern and it is the common criteria used to grab the best accuracy. With a possibility to grasp 78% result, trading becomes simple and effective.
What are chart patterns?
Chart patterns or price figures obey one of the premises of Technical Analysis: “The market has memory and history repeats itself.”
There are a number of patterns that recur throughout history and can be seen through price charts (in different time periodos and markets and assets). Through these patterns the trader can determine with some reliability, the possible evolution of the market price. Of course, none of these patterns has 100% reliability, as they simply provide a clue about what the market may do in the future.
Furthermore, there are some chart patterns which have greater or lesser degree of reliability in comparison with the others, so the trader should use these formations with caution. Also, these formations should be combined with other analysis tools as technical indicators among which we can mention the oscillators, trend indicators, volume, etc.. The point is that we should not base our decisions solely on a chart pattern which we use it primarily as a sign that something may happen in the market.
These patterns are produced because the financial markets do not change direction suddenly. The change of sentiment usually takes time to occur. In this way, these formations can be used to confirm trend changes and set and determine price levels to open new positions and to place stop loss orders and take profits.
There are two main categories of formations used in chart patterns analysis:
Trend Change Patterns
- Double Top
- Double Bottom
- Cup with handle
- Triple Top
- Triple Bottom
- Head and Shoulders
- Head and Shoulders Inverted
- Reversal Day
- Island Reversal
- Diamonds
- Rounding Bottom or Saucer Bottom
- Inverted Rounding Bottom
Trend Continuation Patterns
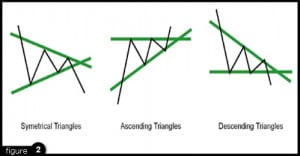
- Triangle Formations
- Symmetrical Triangle
- Ascending Triangle
- Descending Triangle
- Flags
- Pennants
- Wedges
- Rectangles
Other chart patterns
- Channels: Bullish channels, bearish channels and channels without trend (horizontal)
- Expanding Triangle
The volume is another aspect which can help the trader to confirm the order and importance of the patters.
I am Raúl Canessa, the founder of Forexdominion.com. As an experienced Forex trader, my passion for investing and algorithmic trading has shaped my professional journey. Over the years, I have dedicated myself to refining my skills in the financial markets, allowing me to share my knowledge and insights through my platform. I am committed to helping others understand the world of trading and develop effective strategies for success in this exciting field.


 Indicator")
Many people have made a lot of money through Forex trading. Forex trading may appear complicated initially, however once you know the rules of the game it would be become easier to plan your trades. indicator mt4
Drawing trend lines is one of the few easy techniques that really WORK. Prices respect a trend line, or break through it resulting in a massive move. Drawing good trend lines is the MOST REWARDING skill.
The problem is, as you may have already experienced, too many false breakouts. You see trend lines everywhere, however not all trend lines should be considered. You have to distinguish between STRONG and WEAK trend lines.
One good guideline is that a strong trend line should have AT LEAST THREE touching points. Trend lines with more than four touching points are MONSTER trend lines and you should be always prepared for the massive breakout!
This sophisticated software automatically draws only the strongest trend lines and recognizes the most reliable chart patterns formed by trend lines…
Chart patterns such as "Triangles, Flags and Wedges" are price formations that will provide you with consistent profits.
Before the age of computing power, the professionals used to analyze every single chart to search for chart patterns. This kind of analysis was very time consuming, but it was worth it. Now it's time to use powerful dedicated computers that will do the job for you.