The Stochastic RSI was developed to increase the sensitivity and reliability of the regular RSI indicatorespecially when the trader wants to trade during periods when the RSI is in overbought/oversold condition.
Therefore, when the RSI is combined with the stochastic oscillator, a new indicator, the Stochastic RSI, offers better and clearer signals for opening and closing positions.
Now let’s compare the traditional RSI and stochastic oscillator with the Stochastic RSI on the same chart:
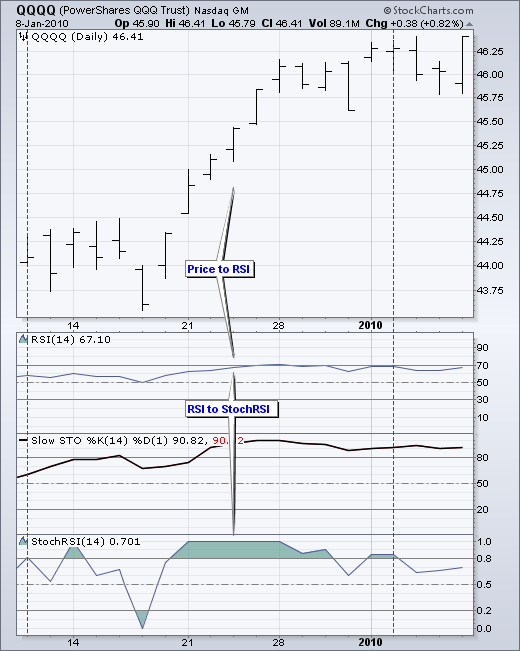
As we can see, unlike other indicators, the RSI Stochastic was able to reach the overbought/oversold levels on more occasions and even remained in these levels longer before moving in the opposite direction.
Now let’s look more closely at the overbought and oversold conditions created by the RSI Stochastic:
Rules to trade with the Stochastic RSI
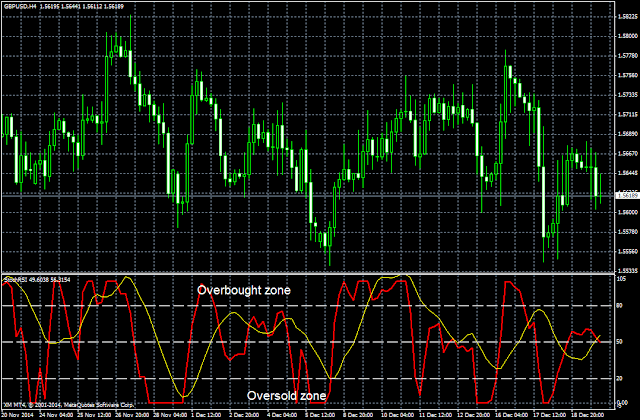
- Wait for the stochastic RSI reaches overbought and oversold levels:
- When the RSI leaves the oversold zone (below 20), we can open a buy position.
- When the RSI leaves the overbought zone (above 80), we can open a short position.
We note that unlike the RSI, where we use the levels 30 and 70 to indicate oversold/overbought conditions, in this indicator the levels used are 20 and 80, the same as in the case of the stochastic oscillator.
Another point to consider is that the reaction to signals from the indicator should occur only after the d% line (the thin yellow line) has also reached the overbought/oversold levels. If this line has not entered the overbought/oversold zone, any buy/sell signal from the Stochastic RSI produced when it crosses the level 80 downwards or the level 20 upwards, should be ignored, at least temporarily.
- Above 50, the trend is up.
- Below 50, the trend is down.
Stochastic RSI formula
The formula to calculate this indicator is the following:
Stochastic RSI = (RSI – Lowest Low RSI) / (Highest High RSI – Lowest Low RSI)
The Stochastic RSI measures the value of RSI relative to its maximum and minimum value throughout the period of time required. When the regular RSI reaches a new low during the period, Stochastic RSI is 0. When the regular RSI reaches a new high during the period, the stochastic RSI is 100.
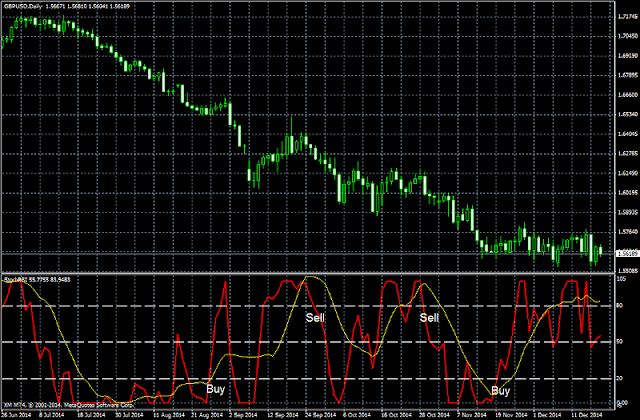
In summary, we can say that when using the Stochastic RSI to analyze the market and open positions, traders should rely on two basic types of signals:
Stochastic RSI in overbought condition (values > 80) or oversold condition (values < 20). When the indicator shows these conditions, and depending on the current trend, the trader can open new buy or sell positions when the indicator exits the overbought or oversold zone (especially if it crosses the 0.50 level, which confirms the signal), as this indicates a possible change in price direction. However, positions should NEVER be opened against the current trend—only in its favor. Therefore, overbought/oversold signals that go against the general trend should be disregarded.
Bullish or bearish crossover of the 0.50 level (the Stochastic RSI’s center line). A crossover of the indicator’s center line suggests the current trend:
- Above 0.50, the trend is bullish.
- Below 0.50, the trend is bearish.
These are the two most effective ways to trade using the Stochastic RSI. Other methods, such as trades based on price-indicator divergences, tend to be less effective with this oscillator compared to the MACD, RSI, and the standard Stochastic Oscillator.
Stochastic RSI for MT4
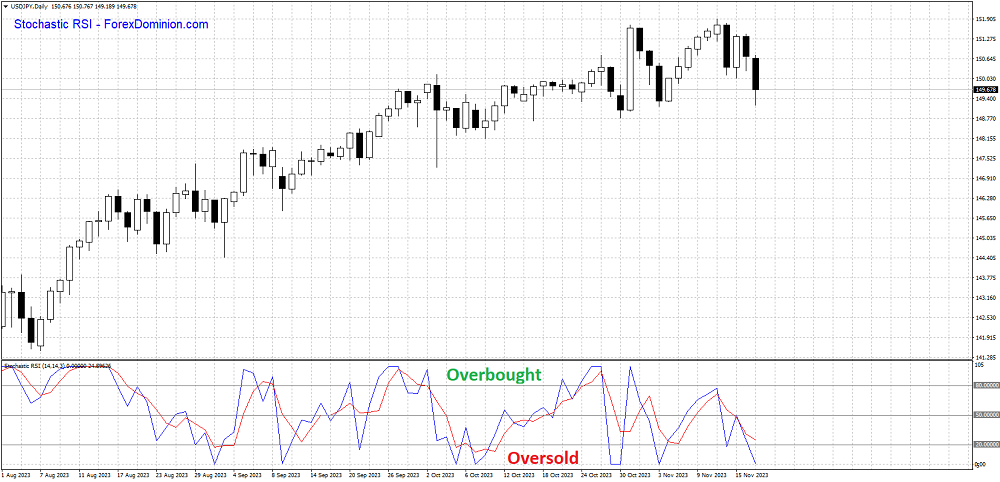
Trading platforms such as MetaTrader 4 do not include the Stochastic RSI in their list of built-in technical indicators, so it is necessary to obtain and install custom indicators that add this tool to the application. For this reason, at Tecnicasdetrading.com we have developed a modified indicator for MT4 that plots the Stochastic RSI in a separate window below the price chart, as shown in the following image:
You can download this indicator in: Stochastic RSI for MT4
Conclusions
The Stochastic RSI is like a “turbocharged” RSI. While the RSI produces relatively fewer signals, the Stochastic RSI is an oscillator that dramatically increases the number of signals. It generally generates more overbought/oversold readings, more centerline crossovers, more good signals—and more bad ones. Speed comes at a cost. This means it’s important to use the Stochastic RSI alongside other technical analysis tools for confirmation.
The examples above use price gaps, support/resistance breakouts, and chart patterns to confirm the signals from this oscillator. Traders who use technical analysis can also rely on complementary indicators such as On Balance Volume (OBV) or the Accumulation/Distribution line. These volume-based indicators do not overlap with momentum oscillators. Traders should also practice with different settings and learn the nuances of the Stochastic RSI before applying it in real trading conditions.
You can access more technical indicators and market analysis tools at: Technical Analysis Tools
I am Raúl Canessa, the founder of Forexdominion.com. As an experienced Forex trader, my passion for investing and algorithmic trading has shaped my professional journey. Over the years, I have dedicated myself to refining my skills in the financial markets, allowing me to share my knowledge and insights through my platform. I am committed to helping others understand the world of trading and develop effective strategies for success in this exciting field.
 - Definition and Signals")

 Indicator")


