The 1-2-3 pattern is a classic trend reversal price formation that occurs in all markets and can be observed in any time frame. It has stood the test of time thanks to its reliability, which is high compared to other chart price patterns. In fact, many trading strategies today are based on this chart pattern.
However, as with all price formations, the problem is learning to spot 1-2-3 patterns on the price charts, which is not easy for beginning traders due to their lack of experience. Also, most traders don’t want to spend their hours watching price charts. I think this is one of the main reasons why pattern-based strategies don’t work for many traders.
For that reason, we include a free custom indicator for Metatrader 4, which shows 1-2-3 bullish and bearish patterns on any price chart and in any time frame. This tool saves the trader a lot of time and works as they do not have to find the patterns on their own.
You can download this custom indicator at no cost through the following link:
Note: We have included an additional 1-2-3 pattern indicator for you to try and see if it is more suitable for you. The custom indicator used in the following images is the 123PatternsV7. In this case, we use a version that has audio and email signals.
Indicator Settings
As we have indicated, the 1-2-3 pattern is a fairly simple price action-based formation, therefore it is recommended to leave all 123PatternsV7 parameters at their current settings. We have included two versions, one with an audible alert (which can be disabled) and another without an alert.
Since price patterns are generally more reliable on larger time frames, we use daily charts for the following examples.
How to use this indicator?
As we see in the following image, the 123PatternsV7 indicator shows buy and sell signals through colored horizontal lines on the signal candles. Instead of displaying the 1-2-3 pattern itself, the indicator shows the entry points generated based on this price formation. The trading signals are as follows:
- Red line: sell signals.
- Blue line: buy signals.
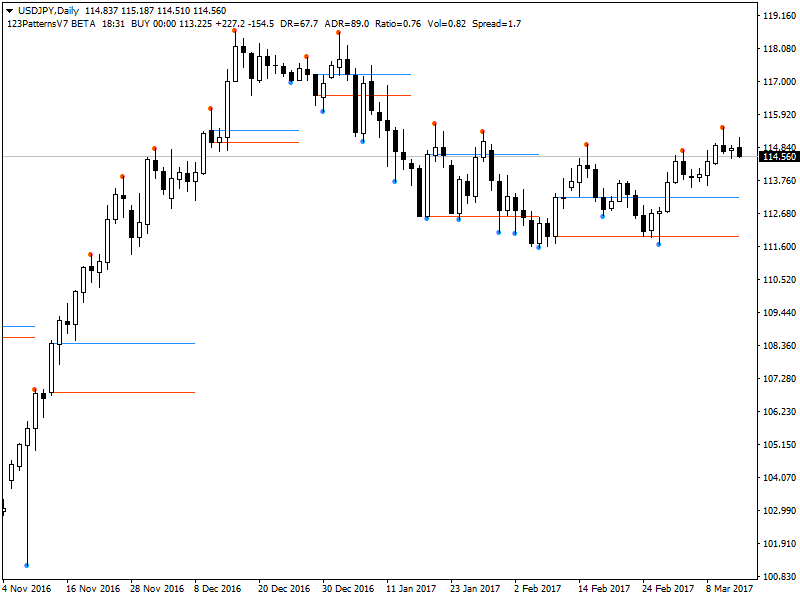
We can see at a glance that the indicator draws both lines (buy and sell) from the body of the signal candle.
The idea here is the following: suppose we have a sell signal (red line) and then the price breaks above the buy line (blue line). This is a good time to close the initial sell position and perhaps switch and open a buy trade (instead of waiting for the initial trade to end in loss).
Continuing with the example, another way to think of the two lines is as a selling area. As long as the price does not close above the sell zone, then it is still valid. If two candles close above the zone then the zone has been broken – it is no longer valid.
When this occurs the selling area often becomes a buying area. (Resistance turns into support).
Alternate indicator for 1-2-3 patterns
If you want an indicator that only traces the 1-2-3 patterns more clearly, you can use the custom indicator show123v2 which is also among the download files. This indicator produces the following signals:

As we can see, it accurately shows points 1, 2, and 3 of each 1-2-3 pattern, although it does not generate entry or exit signals. Despite everything, it can be very useful for those traders who are looking for only a tool that allows them to identify these formations. Surprisingly it was created in 2006 and works well on current versions of MT4.
The letters RH shown by the indicator at certain points stand for “Ross Hook”, a term coined by Joe Ross in his book The Law of Charts.
A Ross Hook is created by:
- The first correction is after the breakout of a bullish or bearish 123 pattern.
- The first correction after the breakout of a “salient” in the market.
- The first correction after the breakout of a price range in the market.
In a bull market, for example, after the breakout of a bearish 123 pattern, the first time the price fails to rise to a new high, a “Ross Hook” is created. A double high or double low also creates a Ross Hoss.
I am Raúl Canessa, the founder of Forexdominion.com. As an experienced Forex trader, my passion for investing and algorithmic trading has shaped my professional journey. Over the years, I have dedicated myself to refining my skills in the financial markets, allowing me to share my knowledge and insights through my platform. I am committed to helping others understand the world of trading and develop effective strategies for success in this exciting field.


