ILRS (Integral of Linear Regression Slope) Indicator for Metatrader 4

ILRS moving average for Metatrader 4

In this article we are going to show a modified technical indicator for Metatrader 4 that plots an ILRS (Integral of Linear Regression Slope) moving average on any price chart of this trading platform. It is a free indicator that was designed by ForexDominion experts and can be downloaded at no cost. The ILRS is a little known and different … Read more

Guppy Multiple Moving Average Indicator For MT4

In this article we present a custom indicator for Metatrader 4 that displays the Guppy Multiple Moving Averages (GMMA) indicator on any price chart. The indicator can be modified to calculate moving averages with different types of prices (such as closing price, opening price or maximum price) and to use different moving averages instead of EMA, such as SMA and … Read more

VIDYA Moving Average Indicator for MT4

In this article we are going to present a custom indicator for Metatrader 4 that is designed to display a VIDYA adaptive moving average overlaid on the price action on the price charts. This indicator can be modified to calculate the moving average with different price types (closing price, opening price, maximum price, minimum price, median price, typical price and … Read more

RSI Signals Indicator for Metatrader 4

In this article, we present a custom dashboard indicator for Metatrader 4, called RSI Signals, which displays multiple signals from the RSI indicator on different instruments and time frames. It is a free custom indicator where the trader can select the currency pairs and time frames they want to view. Also, it is able to show when the RSI is … Read more

KAMA Adaptive Moving Average Indicator for Metatrader 4

KAMA moving average

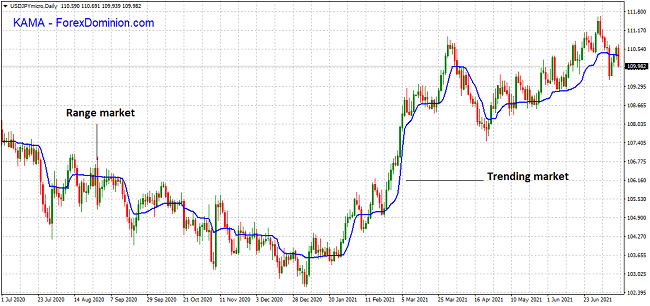
In this article we present a modified indicator for Metatrader 4 designed to plot the KAMA Adaptive Moving Average on any price chart of this platform. It can be modified to show the moving average with different types of prices, such as the closing price, the opening price or the maximum price of each period. Before talking about this modified indicator, we are going to explain what the KAMA moving average is.

What is the KAMA moving average?

KAMA is short for Kaufman’s Adaptive Moving Average. This moving average is designed to automatically adapt to changing trend conditions, thanks to its calculation formula, which is similar to the one used to calculate the exponential moving average (EMA). The difference between the two moving averages is the smoothing factor K, which in the KAMA is determined by a much more complex formula than in the EMA.

Read more

Indicator of Balance of Forces Between Buyers and Sellers in All Time Frames for MT4

In this article we are going to explain a modified indicator for Metatrader 4, which measures the balance of forces between buyers and sellers for each time frame, from M1 to D1, in the form of red and green histograms. This indicator is called Strength Candles, and for each time frame it shows the ratio between buyers and sellers in a range from 0 to 100%. It can be used primarily to determine the strength of the current trend.

The Strength Candles show the total balance between the buying and selling forces in percentage terms. This strength indicator does not use typical indicators such as RSI or moving averages, therefore the information is provided without any delay.

It is not an indicator that provides entry and exit signals like others. Its function is simply to inform about the balance between the forces in the market for different time frames.

Read more

Renko Chart Indicator for Metatrader 4

Renko chart MT4

The MT4 platform is undoubtedly one of the most popular trading platforms among retail traders who regularly trade Forex, CFDs, and precious metals. Despite the popularity and numerous reviews of the MT4 platform, there has been little to no improvement when it comes to including other types of charts. In its current version, Metatrader only offers the classic types of price charts, that is: bar charts, japanese candlestick charts, and line charts.

Although MT4 has shown some lag in terms of chart type innovation, thanks to the large ecosystem of developers who specialize in the MT4 platform, various Renko indicators have been produced that can convert existing chart types to Renko charts.

In this article we are going to take a look at the RenkoLiveChart_v3.0 indicator which is available free of cost, indicating its advantages and disadvantages.

Read more

1-2-3 Patterns Indicator for Metatrader 4

The 1-2-3 pattern is a classic trend reversal price formation that occurs in all markets and can be observed in any time frame. It has stood the test of time thanks to its reliability, which is high compared to other chart price patterns. In fact, many trading strategies today are based on this chart pattern.

However, as with all price formations, the problem is learning to spot 1-2-3 patterns on the price charts, which is not easy for beginning traders due to their lack of experience. Also, most traders don’t want to spend their hours watching price charts. I think this is one of the main reasons why pattern-based strategies don’t work for many traders.

For that reason, we include a free custom indicator for Metatrader 4, which shows 1-2-3 bullish and bearish patterns on any price chart and in any time frame. This tool saves the trader a lot of time and works as they do not have to find the patterns on their own.

Read more