In this article, we will present a modified indicator for Metatrader 4 designed to show harmonic price patterns in any price chart and in any time frame. It is not an official MT4 indicator.
Harmonic price patterns elevate geometric price formations to the next level through the use of Fibonacci numbers to define precise market inflection points. Unlike other trading methods used to trade in Forex and other markets, harmonic trading attempts to predict future price movements.
Harmonic trading can be defined as a trading methodology based on the recognition of specific price patterns and the alignment of exact Fibonacci ratios to find possible high probability trend change levels in the markets. This approach assumes that the patterns or cycles in markets, such as many patterns and cycles in life, tend to be repeated on a regular basis.
In general, harmonic patterns are usually quite accurate and reliable. The trader can use them quite confidently as they can anticipate changes in the price direction that can be used to perform very profitable trades. Of course, harmonic patterns are not completely infallible and as in all trading and analysis methodologies, false signals are also produced, even in the most perfect patterns. However, they have the great advantage that they offer take profit and stop-loss levels that are fairly defined, which avoids speculation. In addition, they present a quite good Risk:Benefit ratio, with a stop loss close to the entry level compared to the levels where the trader can take profits.
However, like all price patterns, the main problem is identification. Many traders do not have the ability to find these formations on their own or do not have the time to price charts throughout the day. This is where the ZUP indicator can be useful.
What is the ZUP indicator?
It is a custom indicator developed on its own by a trader in 2014 and therefore is not among the official MT4 tools. It is based on the ZigZag technical indicator (it find the ups and downs of the pattern) to determine the different movements or oscillations that form the pattern. It also includes the relevant Fibonacci relationships, vital to find the patterns.
The formations that this indicator can find in any instrument and time frame are the following:
- Gartley pattern
- Bat pattern
- Butterfly pattern
- 3-Drive pattern
- Crab pattern
- ABCD pattern
- Others
Something that is interesting about this indicator is that it also traces Andrew’s tridents in the price chart, which makes it possible to complement the trader’s analysis of what is happening in the market.
Before continuing to explain this indicator, we must clarify that it repaints, which is due to the use of the ZigZag indicator. This means that its graphic representation is completely redrawn based on current data. In the case of the ZUP, this may occur with the last component or “leg” of the formation, not with the previous components. Therefore, the trader must be careful in this regard.
Now let’s see two examples:
Example 1: Bearish Butterfly harmonic pattern on a GBP/JPY chart
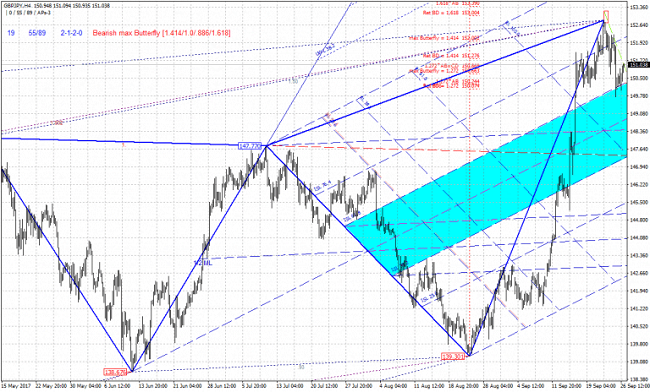
In the previous image, we see an H4 chart of the GBP/JPY where the ZUP indicator has found a bearish Butterfly pattern, drawn with blue lines.
Here we can observe the following:
- Once the pattern is completed the indicator shows its name in the upper left corner, with red letters. In this case, it indicates a bearish Butterfly pattern.
- The lines that make up the pattern are indicated by blue lines.
- Through a red square figure, the indicator shows where the pattern is completed and the area where the position can be opened, in this case, a sell trade. This figure can also be used to determine where we are going to place the loss stop in case the pattern is invalidated.
Example 2: Harmonic Bearish Shark Pattern on a GBP/AUD chart

We now have an image with a bearish Shark pattern detected by the ZUP indicator on an H4 chart of the GBP/AUD pair. As in the previous case, the indicator clearly indicates the name of the detected pattern, clearly traces it through blue lines and highlights the area where the formation is completed and the position can be opened, in this case, a sell trade.
Indicator Settings
This indicator requires some time to get used to it. This is because there are many configurable parameters involved and the trader can even apply the zup indicator to validate some other complex methods that are also based on Fibonacci.
For the beginner trader, it can be confusing at the beginning, but in this case, my recommendation is to leave the parameters as they are without any modification, unless they know what they are doing.
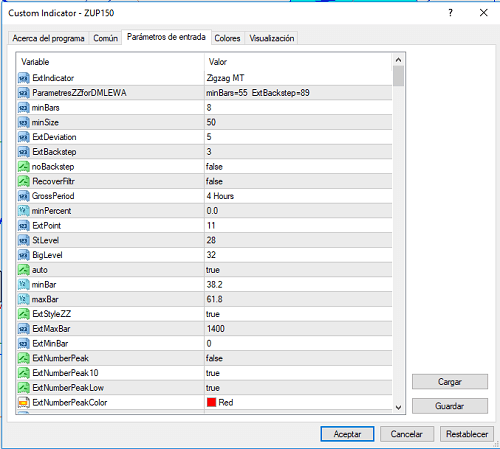
The above image shows the ZUP indicator for MT4 and the adjustable parameters it presents. As you can see, there are several settings that allow you to fully customize this custom indicator. For example, the ZUP indicator can be used to define Fibonacci relationships so that the indicator specifically looks for these patterns.
If you still have an interest in changing parameters, in the download file I include a description of the parameters used in version 1.52 of this indicator in English. Although these are different versions, version 1.50 that we describe in this article uses the same indicators and basic parameters.
Indicator download
You can download the ZUP indicator at no cost (together with an additional harmonic pattern indicator) through the following link:
Installation instructions are included in the download file.
I am Raúl Canessa, the founder of Forexdominion.com. As an experienced Forex trader, my passion for investing and algorithmic trading has shaped my professional journey. Over the years, I have dedicated myself to refining my skills in the financial markets, allowing me to share my knowledge and insights through my platform. I am committed to helping others understand the world of trading and develop effective strategies for success in this exciting field.


