When I think about how to adjust the level of stop loss to volatility, the first thing that comes to mind are the stop losses calculated according to the ATR. It is a dynamic stop loss type that fits very well to trend following.
But today’s question is: are there other ways to calculate a stop loss adjusted to volatility? A good response has been given to me by a blog reader asking me about the Kase DevStop.
What is the Kase DevStop?
Briefly explained is a dynamic stop loss based on the standard deviation of the true range.
Let’s see it in more detail:
The idea of this type of stop loss comes from Cynthia Kase who named it Kase DevStop (we know, the old habit of putting our last name to the things we create).
Well, according to the approach of its creator, this type of stop loss seeks to be an improvement to dynamic stops based on the ATR. According to Kase, the ATR (Average True Range) is insufficient to capture the true volatility of the market.
What is this analyst based on to say that the ATR is insufficient? Well, as we have already analyzed in the article on the ATR indicator, the calculation of the Average True Range is an average of the so called True Ranges. Kase argues that the ATR does not take into account the dispersion between these ranges, since some of the ranges may be higher/lower and this would not affect the value given in the average.
Let’s see how to modify this.
Stop loss calculation
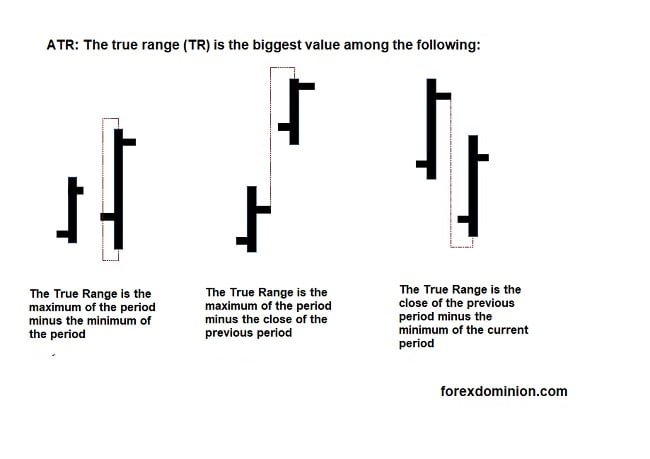
We begin by calculating the True Range, but in this case taking the last two candles.
(The image below shows the classic true range, in the case of the kase devstop we need to do the same but with two bars).
Then we calculate a moving average over this double true range (the formula uses the average of 20 periods to work with daily candles). Note that each range uses two candles for its calculation.
To take into account the dispersion, we calculate the standard deviation of the double true range that we have in point 1 (also for 20 periods if we are working in the daily time frame).
With these 3 steps, we can apply the results obtained to the formula.
DevStop formula
DevStop = average (Double True Range, n periods) + standard deviation (Double True Range, n periods)
Alert lines
From the basic calculation, several alert and stop lines are configured. The options mentioned in the documentation is to work at x 2.2 and x 3.6 deviations.
Stabilization line = average (Double True Range, n periods) + 0 * standard deviation (Double True Range, n periods)
Dev1 = average (Double True Range, n periods) + 1 * standard deviation (Double True Range, n periods)
Dev2 = average (Double True Range, n periods) + 2.2 * standard deviation (Double True Range, n periods)
Dev3 = average (Double True Range, n periods) + 3.3 * standard deviation (Double True Range, n periods)
Critical note: The author justifies the use of 2.2 and 3.3 times the standard deviation due to the asymmetry in the distribution of the double true range, however reading her study does not quite make it clear why she takes as a general rule the results of the stop on a concrete system.
Another thing to comment is that the author explains that Wilder’s classic ATR is calculated as a simple moving average, although Wilder’s smoothing is slightly different.
General use of this trailing stop
A trailing stop is what we could translate as a price following stop. It is a stop that moves with the price, but moves only in one direction: if you are in a long position (buy trade) and the price goes up, the trailing stop goes up too, adjusting to the new price range. On the contrary if the price falls, the trailing stop will not go down. All this is obviously the other way around in the case of short trades.
For example, in this case when we are in a long position we subtract the value of the devstop from the entry price, that is our initial stop point. As the price moves in our favor and goes up, we adjust the positioning by subtracting the devstop from the highest maximum that has occurred while we have the position open. In case the price does not move as we expect or moves against, we do not modify the initial stop. Obviously in case the price crosses our stop we must close the trade
The stop line to use (dev1, dev2, or dev3) will depend on how tight we decide to set the stop point.
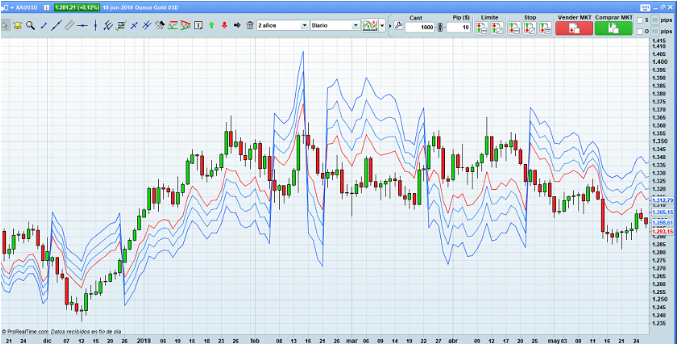
Graphic: dynamic stop lines
Applying the lines in a price chart we can see the Kase DevStop as an indicator applied to the price.
I am Raúl Canessa, the founder of Forexdominion.com. As an experienced Forex trader, my passion for investing and algorithmic trading has shaped my professional journey. Over the years, I have dedicated myself to refining my skills in the financial markets, allowing me to share my knowledge and insights through my platform. I am committed to helping others understand the world of trading and develop effective strategies for success in this exciting field.
 - Volatility Indicator")


 Indicator")

