Center of Gravity Indicator (COG) of John Ehlers
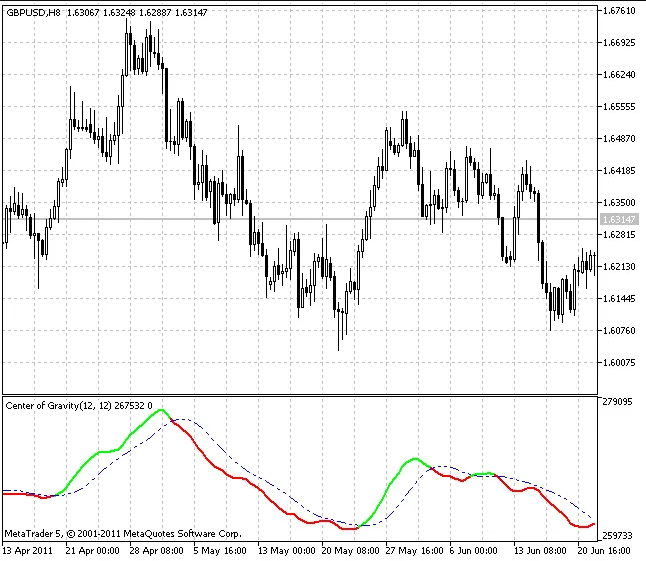
Technical analysis offers traders numerous tools to decode market movements, and among the lesser-known but highly effective indicators is the Center of Gravity (COG). This unique oscillator, developed by renowned engineer and trader John Ehlers, brings a fresh perspective to momentum analysis by applying principles from physics to financial markets. What is the Center of Gravity Indicator? The Center of … Read more