What is the ATR?
The ATR is a technical indicator that measures the volatility of the market. As such, the indicator does not provide information on the direction of the price, but on the degree of movement of the price, or volatility. It was developed by J. Welles Wilder and disseminated in his book, New Concepts in Technical Trading Systems (1978).
Wilder designed several indicators applying them mainly to commodity markets and especially with daily prices. At the time Wilder designed the ATR, commodity markets were among the most volatile markets where price gaps and limit movements were frequent, and continue to be. These gaps result in jumps in the price not reflected in the session data: opening price, maximum price, minimum price and closing price, and therefore this amplitude of movement is not reflected in the range of movement typically calculated using the maximum-minimum range. Wilder began designing the True Range (TR) concept in an effort to appropriately reflect volatility. Unlike the calculations based on maximum and minimum ranges, the TR takes into account the gaps and the limit movements, and is defined as the greater of the following values:
- Current maximum minus current minimum.
- Absolute value of the current maximum minus the closing of the previous candle.
- Absolute value of the current minimum minus the closing of the previous candle.
Observing the three possibilities, we can deduce that if the last two possibilities are greater than the current maximum-minimum range, it can indicate that there has been a gap or limit movement.
Let’s look at an example where you can see three situations where the TR will not use the current maximum-minimum range. Two of the examples show a wide gap, all three have a narrow maximum-minimum current candle range.
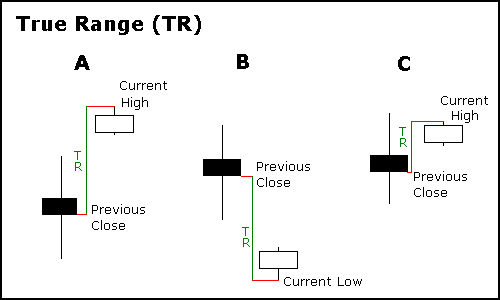
- We see a formation with a small maximum-minimum range after a bullish gap. The TR is the absolute value of the difference between the current maximum and the close of the previous candle, which is, in this case, the highest value among the possibilities described above.
- In this case, there is also a small maximum-minimum range. We see a bearish gap. The TR is the absolute value of the difference between the current low and the previous close.
- The third example shows that the current maximum-minimum range is still small, and although the absolute value of the difference between the current maximum and the previous close is also small, it is greater than that range.
For tango, the TR reflects the range of movement that has taken place much more realistically than the simple minimum-maximum range. If we take for example the illustration 1 in the image above you can see how the maximum-minimum range is small when in fact there has been a much greater movement that is reflected in the TR.
After explaining what is the TR, we can now define the ATR indicator. The ATR, as its name suggests (Average True Range), is the average true range calculated for a given period, typically this period is 14.
ATR calculation
The most typical period to calculate the Average True Range (ATR) for any time frame is 14. Let’s see an example of a calculation for daily data. The calculation period will, therefore, be 14 days. To calculate the ATR you must first calculate the TR. For the first day (first data) the TR is the maximum minus the minimum of the same day since it is the beginning of the series and there are no previous data. To calculate the first ATR value we need to have as many previous TR data as the calculation period we are using, in this case, we need a minimum of 14 TR data, so we will obtain the first ATR value at the end of day 14 (including the TR of the day 14). This first data is the simple average of the TR of the previous 14 days. For the following data of the ATR, Wilder added a calculation formula in which he incorporated the ATR from the previous session, thus softening the results obtained. The calculation for the following sessions is:
((ATRprev x 13) + TRp)/14
ATRprev is the ATR value from the previous session, which is multiplied by 13 and the closest TR value is added to the result. All this is divided by 14.
As you have read, there is always a start for the calculation of the ATR in which the values are not calculated in the same way as the following. This fact makes that the current value of the ATR obtained vary depending on how much historical data you have. However, the difference will not be very large if you compare the ATR calculated from data of 500 sessions with an ATR obtained from data of 600 sessions, but this difference can be significant if you compare the current ATR obtained with data from 30 sessions or 500.
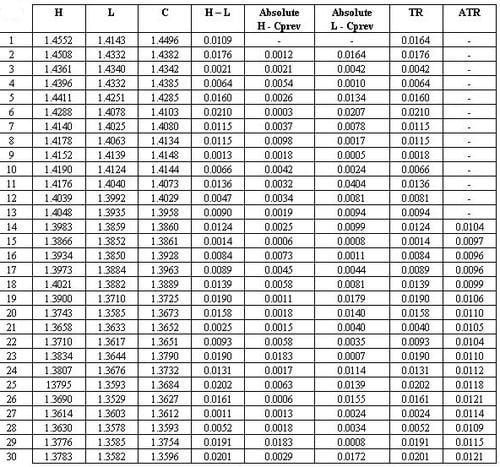
The calculations made in this table correspond to the ATR shown in the following chart:
Uses of the Average True Range (ATR)
As an indicator based on volatility, like the Bollinger bands, the ATR does not predict (nor can it predict) direction or duration of a trend, but rather measures market activity and volatility.
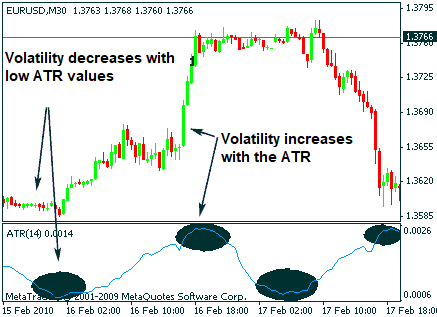
- High ATR values indicate high activity in the market and, therefore, that price movements have high volatility. Very high values occur as a result of a large rise or fall in price and it is highly unlikely that the ATR will remain at high values for a long time.
- Low ATR values indicate little activity and volatility, a calm market in which movements will be short.
- Long-term low ATR values indicate price consolidation and maybe the starting or continuing point of a trend.
In the following image, you can see a M30 price chart of the EUR/USD pair. Look at the ATR’s high and low marks and see how both high and low ATR values can denote a turn in the trend direction. Also, note how the market has little activity when the ATR decreases and how a continuation or trend change follows.
How to use stop loss orders based on the ATR?
Expert traders consider that supports and resistances can be used, among other things, to establish stop loss orders. However, there are also other tools that allow the stop loss to be established in a more objective way, based on market volatility. For this purpose, the ATR can be considered quite useful. For example, we can use this indicator to place a stop loss equal to 25% of the daily ATR for a given trade. Let suppose that the ATR reported that day a valued of 140, therefore, we are going to calculate 25% of that value, which gives us 140 x 0.25 = 35 pips. Already acquired this information you could place a “Stop Loss Order” of 35 pips from your entry point. Based on this result, we can place the stop loss 35 pips from the entry point for that position.
We can also use multiples of the ATR to determine market exit points. For example, the Chandelier stop is a technique that can also be used to define stop loss levels based on market volatility.
This is just an example of how to use the ATR to trade in the market, but the general idea can be applied to trade in other scenarios. Just remember that the ATR is a measure of the market volatility, no of its trend.
I am Raúl Canessa, the founder of Forexdominion.com. As an experienced Forex trader, my passion for investing and algorithmic trading has shaped my professional journey. Over the years, I have dedicated myself to refining my skills in the financial markets, allowing me to share my knowledge and insights through my platform. I am committed to helping others understand the world of trading and develop effective strategies for success in this exciting field.
 Indicator")


 Indicator")
