The RSI Divergence indicator is a modified version of the classic RSI oscillator developed for Metatrader 4, which offers the possibility to trade not only with the classic overbought and oversold levels but also to find the classic and hidden divergences between price and indicator, which often only more experienced traders can detect. This indicator can be used with any asset and in any time frame, although the most reliable signals are generated in the larger time frames.
We describe the characteristics of this indicator below and include a link for its free download:
RSI Divergence General Characteristics
- Currency pairs: Can be used in any currency pair, but is recommended for use in major pairs such as EUR/USD, GBP/USD, or USD/JPY. It can also be tested in other markets, such as commodities or indices.
- Time Frame: Can be used in any time frame, but higher time periods such as H4 and D1 are the most recommended because the market has less “noise” and price patterns are more clearly displayed and reliable.
- Trading time: All day (be careful during the days when there are important announcements and economic indicators).
- Trading platform: The indicator was developed exclusively for Metatrader 4.
- Recommended broker: Can be used in any broker that offers the Metatrader 4 platform, like RoboForex for example.
Example of RSI Divergence Signals
Of course, the RSI Divergence indicator can be used as an independent source of market entry signals to open buy or sell positions, however, it is recommended to use this tool in combination with additional filters or as part of a trading strategy.
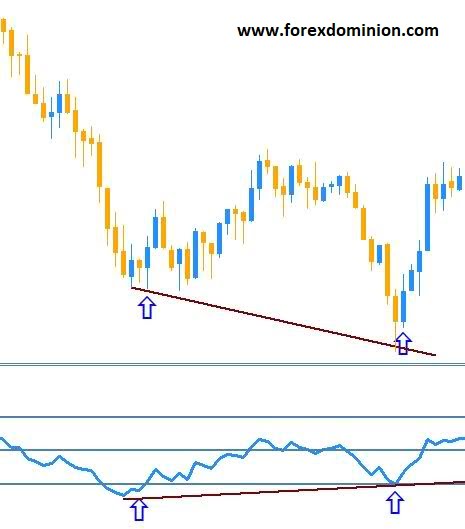
As for the trading signals it produces, the indicator offers the same information as the classic RSI indicator, showing among other things, when the price is in an overbought or oversold condition. Additionally, it also indicates when there are divergences between the RSI and the price, which offer good opportunities but in many cases are difficult to detect, especially for the inexperienced trader.
RSI Divergence traces trend lines in the price chart to indicate the direction of the market and at the same time shows bullish and bearish arrows in the RSI, so the trader can detect divergences by simply glancing at the graph.
As we can see in the previous image, the RSI Divergence shows trends in price and in the RSI indicator using colored lines and arrows. In this way, it is much easier to identify price-indicator divergences. In this case, the indicator was used on a GBP/USD price chart of 1 hour (H1). For example, thanks to the indicator can be seen a clear bearish divergence between the price and the RSI, which is indicated by red lines and arrows. Shortly after the divergence is formed and detected, the price began to fall sharply.
Download and installation of RSI Divergence
You can download the indicator along with the template using the following link:
The indicator consists of the following files:
- RSI Divergence.ex4 (indicator file)
- RSI Divergence template.tpl (system template)
The RSI Divergence.ex4 file must be placed in the /MQL4/Indicators folder of the Metatrader 4 installation on the computer. For its part, the RSI Divergence template.tpl file is placed in the /templates folder of the Metatrader 4 installation. To activate the indicator, the platform must be restarted.


