In this article, we present a trading strategy developed and kindly provided by a collaborator named Erick Diaz Guerra.
This strategy uses an automatic indicator of supports and resistances; and as a filter, the standard stochastic oscillator of MetaTrader 4, a known technical indicator used in many trading systems. The strategy is based mainly on the likely price rebounds made in the supports and resistances. The stochastic serves to confirm the rebound movement. The approach seems simple and interesting at the same time, though I have not tried the strategy, however, I am planning to include it in the list of systems awaiting assessment. According to its author, the strategy has performed well in the backtesting and in a demo account, so he has decided to use the system with a real account.
Now let’s see a complete description of the strategy.
Trading Strategy Description
Overall, this trading system is based on the rebound movements performed in the price levels of support and resistance. The stochastic oscillator indicator serves as a tool to confirm these rebounds.

Entry signals rules
The entry signals to open new positions occur when one of the tails of the candlesticks reach and fail to cross through one of the support/resistance levels marked by the indicator. Ideally, the trader should use a level from blue onwards, but you can use the green levels if you want to make scalping trades (short trades in which the entry and exit are fast, even a few seconds). Examples of possible entry signals are shown in the following chart:

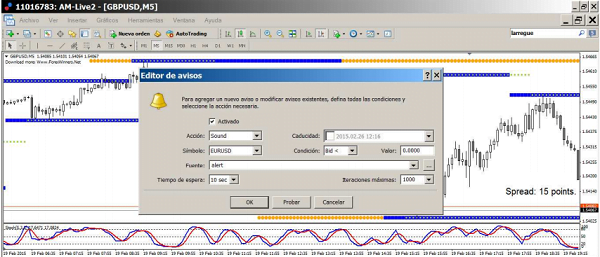
The author suggests using a stop loss in a level equivalent to 2 spreads beyond the level of resistance or support. Concerning the profit-taking, it depends on each trader but is recommended to use the same value as used in the stop loss, to have a healthy Benefit/Risk ratio. It is also recommended to predefine alerts on price levels that are close to resistances and supports, to be more attentive to the entry signals. Alerts can be created in the “Terminal” bar at the “Messages” tab and in the top where the fields are described, we must right-click to click on “Create“.

Another recommendation is to trader with the Bid prices as these are the prices used to trace the candlesticks. Likewise, the trader is suggested to define alerts about 2 spreads before the price reaches the resistance or support, so you have time to plan the trade and calculate the risk assumed.
According to the results of backtesting, in most cases, once the support and resistance created by the indicator are crossed, the price tends to not bounce at these levels. In the following chart, we can see how the price crosses the levels they had previously been broken.

You can download the template and custom indicators for Metatrader 4 on the following link:


