What is the stochastic oscillator?
The Stochastic Oscillator is a popular technical indicator used in financial market analysis, particularly in trading. It is a momentum oscillator that compares the current price of an asset to its price range over a certain period of time, typically 14 days. The Stochastic Oscillator was developed by George Lane, a prominent technical analyst, in the late 1950s. Lane was a futures trader and broker who became interested in developing a technical indicator that could identify overbought and oversold conditions in the market.
Lane observed that the price of an asset tends to close near its high during an uptrend and near its low during a downtrend. He also noted that the momentum of the price trend tends to slow down before a reversal occurs.
Based on these observations, Lane developed the Stochastic Oscillator as a way to measure the relationship between the current price of an asset and its price range over a certain period of time. The indicator was initially designed for use in the commodities market, but it has since become a popular tool in all financial markets, including stocks, Forex, and futures.
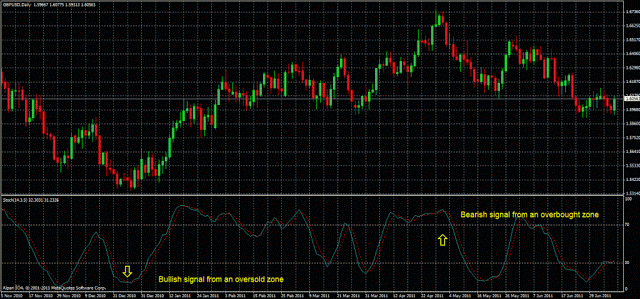
The Stochastic Oscillator measures the degree to which an asset’s price has moved up or down relative to its range over a given time frame. It ranges from 0 to 100, where a reading above 80 is considered overbought, and a reading below 20 is considered oversold.
Traders use the Stochastic Oscillator to identify potential overbought or oversold conditions in the market, which may indicate a potential reversal in the price trend. In addition, the Stochastic Oscillator can also be used to identify bullish and bearish divergences between the oscillator and the price chart, which may indicate a potential trend reversal.
Overall, the Stochastic Oscillator is a useful tool for traders to identify potential trading opportunities in the market, although it should be used in conjunction with other technical indicators and fundamental analysis for a comprehensive market analysis.
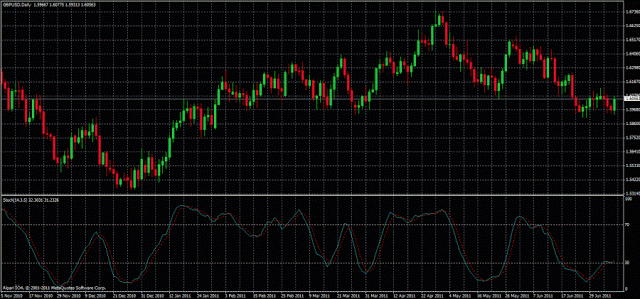
This indicator consists of two lines called %K and %D. The %K line is the stochastic itself and the%D line is a moving average of% K (again we have two lines obtained from the same calculation, a slow one(% D) and a fast one(% K) whose intersections can be used as signals to buy and sell).
How is the stochastic oscillator calculated?
The Stochastic Oscillator is calculated using the following formula:
Where:
- H is the highest price over the last n periods.
- L is the lowest price over the last n periods.
The Stochastic Oscillator formula calculates the position of the current closing price relative to the price range over a specified period of time. The result is expressed as a percentage and ranges from 0 to 100.
The Stochastic Oscillator is typically used in conjunction with a moving average, called the %D line, to smooth out the stochastic oscillator line and provide more accurate trading signals. The %D line is calculated by taking a 3-day simple moving average of the %K line.
Traders typically use the Stochastic Oscillator to identify potential overbought or oversold conditions in the market. A reading above 80 is considered overbought, which may indicate that the asset is due for a price correction or reversal. Conversely, a reading below 20 is considered oversold, which may indicate that the asset is undervalued and due for a price rebound.
Main signals and uses of the stochastic oscillator
- Overbought and oversold signals: The Stochastic Oscillator provides overbought and oversold signals based on the %K and %D lines. When the %K line rises above 80, it indicates that the asset is overbought and may be due for a price correction or reversal. Conversely, when the %K line falls below 20, it indicates that the asset is oversold and may be due for a price rebound.
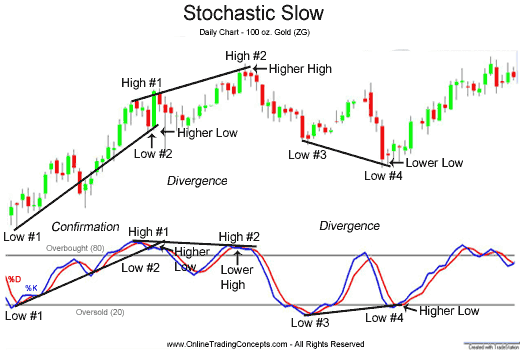
- Price/Indicator divergences: Traders also use the Stochastic Oscillator to identify potential divergences between the price trend and the momentum trend. Analogous to the divergence of any other oscillator (the MACD and RSI for example), sometimes the stochastic oscillator presents divergences with the price which can be bullish and bearish and can be used as signals to trade in the market. For example, if the price of an asset is trending higher but the Stochastic Oscillator is trending lower, it may indicate that the price trend is losing momentum and a reversal may be imminent.
- Trend identification: The Stochastic Oscillator can also be used to identify the overall trend of an asset. If the %K and %D lines are both rising, it indicates that the asset is in an uptrend. Conversely, if the %K and %D lines are both falling, it indicates that the asset is in a downtrend.
- Crossovers: The most common stochastic oscillator crossover signals are the %K line crossing the %D line and the %D line crossing the signal line. When the %K line crosses above the %D line, it’s considered a bullish signal, indicating a potential uptrend. Conversely, when the %K line crosses below the %D line, it’s considered a bearish signal, indicating a potential downtrend.
Overall, the Stochastic Oscillator can be a useful tool in a trader’s technical analysis toolkit, helping them to identify potential trading opportunities and manage risk by avoiding overbought or oversold conditions. However, like any technical indicator, it should be used in conjunction with other analysis tools and risk management strategies to make informed trading decisions.
Stochastic Oscillator Disadvantages
While the Stochastic Oscillator is a popular technical analysis tool, there are several potential disadvantages and limitations to consider when using it in trading. Here are some of the key disadvantages:
- False signals: Like many technical indicators, the Stochastic Oscillator can generate false signals, particularly in volatile or choppy markets. Traders may need to use additional filters or confirmation tools to help validate potential signals.
- Lagging indicator: The Stochastic Oscillator is a lagging indicator, meaning it’s based on past price data and may not provide an accurate view of current market conditions or future price movements. Traders may need to use other indicators or analysis tools to supplement the Stochastic Oscillator and get a more complete picture of the market.
- Sensitive to market noise: The Stochastic Oscillator can be sensitive to market noise, particularly in short-term timeframes. This can lead to false signals or choppy trading conditions.
- Limited use in certain market conditions: The Stochastic Oscillator may not be effective in certain market conditions, such as strong trending markets or markets with low volatility. In these situations, traders may need to use other indicators or analysis tools.
- Requires parameter tuning: The Stochastic Oscillator requires traders to choose appropriate parameters, such as the time period and smoothing factor. These parameters can have a significant impact on the indicator’s effectiveness and may require some trial and error to find the optimal settings.
With which indicators can the stochastic oscillator be combined?
Traders often use the stochastic oscillator in combination with other technical indicators to confirm signals and generate more reliable trading strategies. Some indicators that can be used in conjunction with the stochastic oscillator include:
- Moving Averages: Traders often use moving averages to identify the direction of the trend and to confirm signals generated by the stochastic oscillator. For example, a trader may only take bullish signals from the stochastic oscillator when the price is above its 200-day moving average.
- Relative Strength Index (RSI): The RSI is another popular momentum indicator that can be used in combination with the stochastic oscillator. Traders can look for confirmation of signals generated by the stochastic oscillator with signals from the RSI.
- Bollinger Bands: Bollinger Bands are a volatility indicator that can be used to identify potential support and resistance levels. Traders can use the stochastic oscillator to confirm signals generated by the Bollinger Bands and to identify potential trend reversals.
- Fibonacci Retracements: Fibonacci retracements are a popular technical analysis tool used to identify potential support and resistance levels. Traders can use the stochastic oscillator to confirm signals generated by Fibonacci retracements and to identify potential trend reversals.
It’s important to note that combining multiple indicators can help traders generate more reliable signals and trading strategies, but it’s also important to avoid overcomplicating the analysis. Traders should always use proper risk management strategies and validate potential signals with other analysis tools before entering a trade.
Stochastic Oscillator Trading Strategies
The following is a list of Stochastic Oscillator trading strategies that are described on ForexDominion:
- Trading System with RSI and Stochastic Oscillator
- Trading system with stochastic oscillator and CCI indicator
- Intraday Trading System Using Moving Averages and Stochastic
- Trading Strategy with Supports, Resistances, and Stochastic
I am Raúl Canessa, the founder of Forexdominion.com. As an experienced Forex trader, my passion for investing and algorithmic trading has shaped my professional journey. Over the years, I have dedicated myself to refining my skills in the financial markets, allowing me to share my knowledge and insights through my platform. I am committed to helping others understand the world of trading and develop effective strategies for success in this exciting field.
 Indicator")

 - Definition and Signals")
 - Main Features")

