This trading system based on technical analysis combine three of the most used technical indicators. The moving average is a trend indicator and the stochastic and the RSI are oscillators used to determine when the market is oversold and overbought and the strength of the price movement, so this combination can provide safer trading signals.
Introduction
This is a simple trading technique that combines the use of the RSI, the stochastic oscillator and the moving averages. It is an easy to use strategie that can be used to trade in any market. Because this trading technique use oscillators is most commonly recommended for markets that are not moving with a strong trend as it can produce multiple false signals.
If you use this strategy in a trending market, you must open your positions until all specified trading conditions are met.
Trading Instruments
This trading technique can be used to trade with any instrument, including Forex, precious metals and indices.
Indicators
- 1 daily candlestick daily chart. However you can test it with any period.
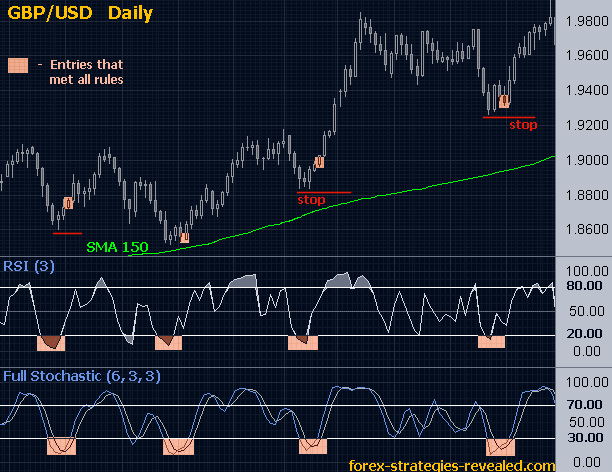
- RSI (3) with levels at 20 and 80.
- Stochastic oscillator (6,3,3) with levels at 30 and 70.
- A SMA moving average of 150 periods at close. You could also try the EMA 100, EMA 80 or EMA 55 to get more signals (These EMA are most sensitive to market movements).
Trading System Rules
- Long positions: When the candles are above the moving average of 150 periods, the RSI is below the level 20 and the stochastic lines have crossed each other below the level 30, the trader should open a long position.
- Short positions: When the candles are below the moving average of 150 periods, the RSI is above the level 80 and the stochastic lines have crossed each other above the level 70, the trader should open a short position.
- Stop loss: The stop loss is placed above the previous maximum (short position) or below the previous minimum (long position) that have been formed.
- Take Profit: You can take profits when the first stochastic line cross above the 70 level (uptrend market) or below the 30 level (downtrend market). Also, you can use a trailing stop that can be activated for the first time when the the stochastic arrives to 70 (30) in a uptrend (downtrend) market. The trailing stop is placed below(above) the lowest(highest) price of the previous candle and is moved with each new candle.
You can apply Fibonnaci too for the most recent movements to predict short term retracements. In this way a trader can be sure of not being out of the market too soon due to a market retracement against him.
Aditional Notes About This Trading System
- One of the main advantages of this trading system is that even if we lose in three consecutive trades, with only one winning trade we can recover from losses and make profits, of course if we follow the rules strictly.
- You may try the EMA 100, the EMA 80 or the EMA 55. The traders should experiment to see which one performs best for theirr chosen currency pairs.
- Remember that in a strong uptrend (downtrend) market, the oscillators can indicate an overbought (oversold) condition, however this is not always a sign of trend reversal, so the trader must be careful when applying this trading technique. For that reason we use the SMA or EMA to stablish the direction of the trend and trade in that direction, so is not advisable to trade against the trend.
Example of ths System
I am Raúl Canessa, the founder of Forexdominion.com. As an experienced Forex trader, my passion for investing and algorithmic trading has shaped my professional journey. Over the years, I have dedicated myself to refining my skills in the financial markets, allowing me to share my knowledge and insights through my platform. I am committed to helping others understand the world of trading and develop effective strategies for success in this exciting field.
 Indicator")


