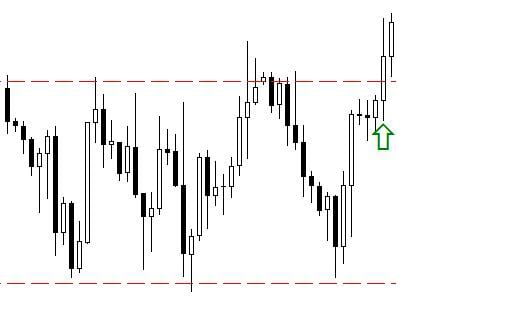
In this article we will show an interesting way to trade with the data of the Non-Farm Payrolls of the United States.
There was a time when trading with macro data was especially interesting. If the data deviated x% of what the market was waiting for, we could perform a trade expecting the price to have an interesting continuity. In fact, not only can you manually perform the trade, but there are interesting software that could execute the operation in hundredths of a second by clicking the buy or sell button of our broker just by programming it (like Expert Advisors in MT4).
However, after a well-known broker was about to go bankrupt, due to the problems caused by this type of operation, the matter gradually became more complicated. In this way, trading on economic data as soon as it comes out, is no longer a good business. Although demo can be interesting, I assure you that trading in those seconds after the data is released can be a drama. Do not try that at home. However, trading with macro data can be especially interesting with the necessary adjustments.
I will show you one that has been especially useful to me.
First of all, it’s good to know that there is nothing worse than getting into a market in which absolutely nothing happens. Time passes very slowly and is so exasperating that we can rush into the decisions we make. On the other hand, trading with macro economic data combines the two elements that we sometimes find difficult to overcome when we trade. On the one hand, we know when we should be in front of the screen. Today we can know at 14:30 in Spain, one hour before the US market opens, whether we will have a trade or not. There is no other issue, if there is a trade then it is done, but if there is no trade we simply turn off the computer. We do not have to wait long hours in front of a tedious market. And on the other hand we can know when something is really happening in the market seeing the interest of the participants in it.
An economic data, of course, that focuses the attention of the participants, such as the Non-farm payrolls. But the confirmation is in the reaction they have at that moment. If at such an important moment we do not see movement, that will warn us that the participants do not see the data interesting and therefore we will not trade. But if we see a strong movement, added to the moment it occurs, we can have a good chance of seeing an interesting trade. Let’s go, therefore, with the setup.
Setup description
- Trading instruments:USD/JPY or USD/CAD.
- Timeframes: 1 minute (M1).
- Trade when there is a movement of 20-30 pips, not before the publication of the economic data
If after the publication of the non-agricultural payrolls we see at least a movement of 30 pips, then we have an alert and we must prepare to operate. It is likely that we have an entrance. With this movement we can conclude that the participants consider that the data that has just been published is interesting.
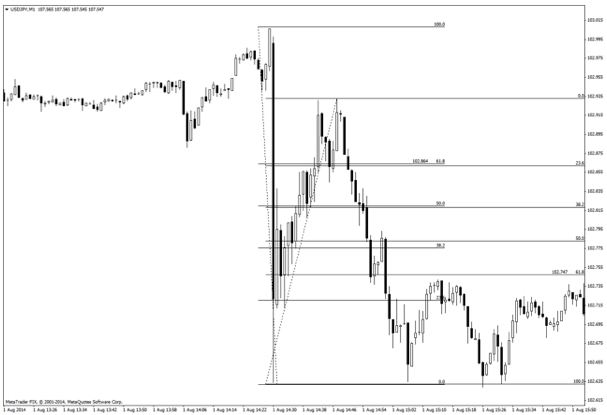
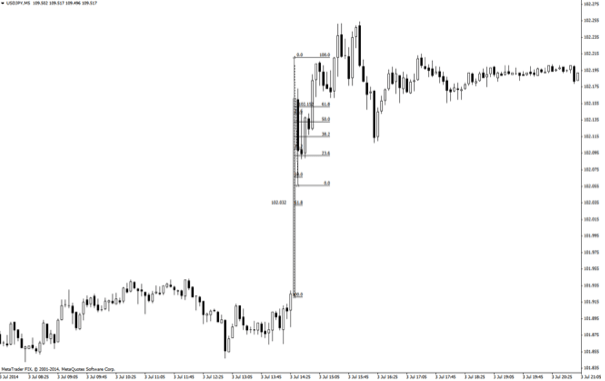
What will we do next? We plot the Fibonacci levels from the close of the previous one-minute candle, when the data is released.From that moment, and once the 30 pips have been reached, we wait the price to correct approaching the Fibonacci level of 38%. Once the price completes this movement, we will plot the Fibonacci levels in the opposite direction to place the entry order at the Fibonacci level of 50%, with the first take profit at 100% and the second at 161%. Of course, we should take into account the re-entry in case the price do what I call a “the second one is overdue”.
Example of movement due to Non Farm Payrolls publication with a great correction
Example of a correction movement in a 1 minute price chart after the publication of the NFP:

