The ADX is an oscillator-type technical indicator that fluctuates between 0 and 100 and whose value is based on the true range of movement (TR, true range). The ADX was developed by Welles Wilder in order to obtain information about the strength of the current trend and determine if the market is in a clear trend or in a range. Additionally, the ADX also serves to inform the trader about the prevailing trend of the market through the positive/negative movement indicators (+ DI and -DI).
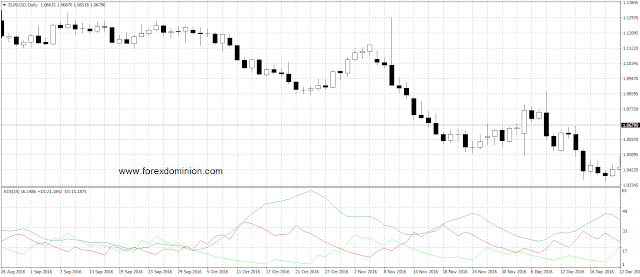
The ADX is the abbreviation of the name Average Directional Index. When this indicator is applied to a chart we can see three lines:
- The line + DI (Positive Directional Indicator).
- the line -DI (Negative Directional Indicator).
- The ADX line.
To understand what the indicator measures and the concept that it transmits is important to be familiar with both the TR and the ATR so I recommend you first read the article: The Average True Range
Formula and values of the ADX
As mentioned above, the ADX is an oscillator-type indicator which fluctuates between 0 and 100 although it is important to note that readings on level 60 are given rarely. The values of the different lines in the ADX come from the following formulas:
- + DI (Positive Directional Indicator): This is the indicator´s line of positivi direction that measures the presence of upward movements. It is calculated from the following formula:
+ DI = + DM / TR
Where + DM is the sum of movements in a positive direction and TR is the True Range for a given period.
- -DI (Negative Directional Indicator): The – DI line measures the presence of downward movements in the market and is calculated using the following formula:
-DI =- DM / TR
Where -DM is the sum of the negative movements and TR is the True Range for a given period period of time.
- ADX (Average Directional Index): This is the line that names the indicator and it is to used to determine the strength of the trend. Its calculation derived by dividing the difference between + DI and-DI and the sum of both:
ADX = ((+ DI) – (-DI)) / ((+ DI) + (-DI))
Interpretation of the ADX
As we can deduce from the formula mentioned above, the lines + DI and -DI inform us about the direction of market movements, while the ADX line indicates the state of the market, that means if the market is in a trend or in a range.
- Trend: If the +DI line is above the -DI line that is a signal that the market is in an uptrend. On the contrary, it is said that the market is in a bearish trend when the -DI is above + DI. The buy signal is produced when the +DI crosses from the bottom up the -DI. The sell signal is originated when the -DI crosses the +DI from the bottom up. Note that both cases the crossing occurs from the bottom up. This is obvious if you think about the meaning of each line, the + DI measures the upward movement while the- DI measures the downward movement, so the trend is in the same direction as the movement of the line with a higher value.
- Signal strength: The strength of the signals provided by the intersections of the lines +DI and -DI is information obtained from the ADX line. In general, if the ADX has a value above 25 we can say that there are large trend movements in the market, in other words, we can consider that volatility is sufficient to use with confidence the buy/sell signals because the market is not in a range. If the ADX is below 20, the market movements are of limited extension, so the trend trading signals of the +DI and -DI could be considered as week. A value of the ADX above 40 indicates a strong trend, either bearish or bullish. In summary, if the ADX is below 25 the trader should stay off the market, but if the indicator is over 25 we can consider the signals generated.
- Entry and exit of the market: A common way to use the ADX is to enter the market in the direction specified by the lines +DI and -DI at the time in which the value of the ADX crosses the level 25 from the bottom up. Another common use of this indicator is to take signals from the intersection of +DI and -DI if the ADX is above 25 (without the ADX crossing the level 25 at the same time). To exit the market, the commonly used signal is the crossing of the +DI and -DI lines in the opposite direction (which indicates a trend change), the ADX crossing of the level 40 from top to bottom (this indicates a possible depletion of the directional movement or trend), and also the ADX crossing of the level 25 from top to bottom (in cases where the level 40 has not been exceeded). If a signal is produced and the ADX is below level 20 we have a strong signal that we should not trade.
- The extreme point rule: The extreme point rule of the Average Directional Index is used to confirm the signals. It consists of taking the extreme (maximum or minimum) of the candle in which is produced the intersection of the lines +DI and -DI. If the crossing is +DI over -DI (buy signal), we take the maximum of the candle as an extreme point and the buy signal is confirmed if the currency pair price exceeds this extreme. In the event that the crossing is of +DI over -DI (sell signal), the extreme point will be the minimum of the candle in which is produced the intersection and the sell signal is confirmed if the price falls below this extreme. In both cases is better if the ADX is above level 25 as described above in the second point.
rcanessa
I am Raúl Canessa, the founder of Forexdominion.com. As an experienced Forex trader, my passion for investing and algorithmic trading has shaped my professional journey. Over the years, I have dedicated myself to refining my skills in the financial markets, allowing me to share my knowledge and insights through my platform. I am committed to helping others understand the world of trading and develop effective strategies for success in this exciting field.
 Indicator")

 - Volatility Indicator")


 - Main Features")