Chart patterns known as harmonic patterns are undoubtedly one of the classic patterns which have been studied by many traders throughout their training within technical analysis. By mastering these types of price patterns, the use of this type of technique can provide early entries with a minimum of risk very near to price levels where there are trend changes. Harmonic patterns can be observed in any market.
For the short term, day traders can use this type of pattern in an effective way to buy and sell when the price touches an area of daily highs or lows. Gartley, the discover of this patterns, stated in his work that to buy or sell properly within a pattern of the type “AB = CD” (the best known among us) the market must be on a strongly established trend.
A change in a market trend or a strong correction may not always follow this pattern but you can even make profits by trading this price formation with proper money management and risk management in each trade, which requires some experience.
The pattern “Gartley 222” is named after the number of the page where it is explained (in H.M. Garley’s own book “Profits in the Stock Market”). Since then, multiple books and financial analysts who have tried these types of harmonic patterns, extended the name under the pattern “222”. Of the nearly 500 pages we find in H.M Gartley’s book, none is more important than pages 221 and 222. It is there that the author describes his patterns in greater detail. Needless to say, the chart pattern described by Gartley is referred to as one of the most effective patterns and can generate quite a few benefits.
The harmonic patterns
The first two Fibonacci ratios that we will find within the harmonic trading are:
- The first Fibonacci ratio of 1.618
- The previous reciprocal ratio 1/1.618, resulting in 0.618
From these two Fibonacci ratios you can get really interesting patterns inside trading, especially from the technical analysis of price charts. In addition we can obtain other ratios that are calculated through these previous ratios:
- Square root of 1.618 = 1.27
- Square root of 0.618 = 0.786
- Square root of 0.786 = 0.866
All these ratios are important and fit perfectly into the formation of harmonic patterns in trading. In fact all the work of Gartley patterns is based on these ratios.
The Gartley patterns
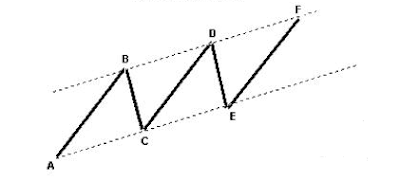
Gartleys are patterns that include the basic ABCD pattern we discussed earlier, but are preceded by a significant high or low. Now these patterns are generally formed when a general trend correction occurs and resembles an “M” (or a “W” for bearish patterns). These patterns are used to help traders get on the general trend.

What makes Gartley such a cool setup, when it is formed, is that the reversal points are a Fibonacci retracement and a Fibonacci extension level. This gives a stronger indication that the pair will actually reverse.This pattern can be difficult to detect and, when you do, it can be confusing to use all those Fibonacci tools. The key to avoid all the confusion is to take things one step at a time.
In any case, the pattern contains an ABCD bullish or bearish pattern, but is preceded by a point (X) that is beyond the D point. The “perfect” Gartley pattern has the following characteristics:
- The AB movement must be the 0.618 retracement of the XA movement.
- The BC movement must be the 0.382 or 0.886 retracement of the AB movement.
- If the retracemente movement BC is 0.382 of movement AB, then CD movement must be 1.272 of movement BC. Consequently, if the movement BC is 0.886 of movement AB, then CD must extend 1,618 of movement BC.
- CD movement should be a retracement of 0.786 of movement XA.
Animal figures within the Gartley patterns
As time went on, the popularity of the Gartley pattern grew and people discovered their own variations.
For some strange reason, the discoverers of these variations decided to give them names of animals, perhaps with the intention of spreading the harmonic patterns through a more colloquial form.
The Crab Pattern
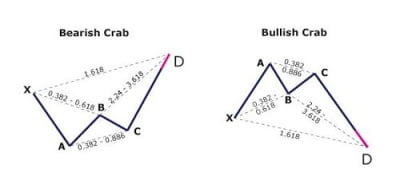
In 2000, Scott Carney, a firm believer in harmonic price patterns, discovered the “crab.” According to him, this is the most accurate among all harmonic patterns, because of the extreme potential reversion zone from the XA movement.
This pattern has a high risk-reward ratio because you can place a very tight stop loss. The “perfect” crab pattern should have the following aspects:
- The AB movement must be the 0.382 or 0.618 retracement of the XA movement.
- The BC movement may be the 0.382 or 0.886 retracement of the AB movement. If the retracement of the movement BC is 0.382 of movement AB, then CD must be 2.42 of movement BC. Consequently, if the movement BC is 0.886 of the movement AB, then CD must be the extension 3,618 of the movement BC.
- CD should be the 1.618 movement XA extension.
The Butterfly Pattern

- The AB movement must be the 0.786 retracement of the XA movement.
- The BC movement may be the 0.382 or 0.886 retracement of the AB movement.
- If the retracement of the BC movement is 0.382 of movement AB, then CD must be 1.618 of movement BC. Consequently, if the movement BC is 0.886 of movement AB, then CD must extend 2.618 of movement BC.
- CD should be the extension 1.27 or 1.618 of the XA movement.
The Bat Pattern

For the year 2001, Scott Carney found another harmonic price pattern called “bat”. The Bat pattern is defined by the 0.886 retracement of the XA movement as a potential reversion zone. The bat pattern has the following qualities:
- The AB movement must be the 0.382 or 0.500 retracement of the XA movement.
- The BC movement may be the 0.382 or 0.886 retracement of the AB movement.
- If the retracement of the movement BC is 0.382 of the movement AB, then CD must be the extension 1.618 of the movement BC. Consequently, if the movement BC is 0.886 of the movement AB, then CD must be the extension 2.618 of the movement BC.
- CD should be the retracement 0.886 of the movement XA.
How can I detect harmonic patterns automatically?
Currently, there are mostly paid software applications that are designed to detect harmonic patterns in any price chart and time frame. Free apps with this feature, including indicators for platforms like MT4, are few and limited, with few exceptions.
However, there is a fairly comprehensive free indicator called ZUP that can plot a large number of harmonic patterns on charts, along with other tools like the Andrews Pitchfork. You can get more information and download this indicator at no cost in the following article: ZUP indicator for Metatrader 4
Aspects to consider before using harmonic patterns
Harmonic patterns are extremely accurate and require price to make movements of a certain magnitude so that a turning point can be accurately determined. Harmonic patterns, beyond geometry, require compliance with a series of relationships within the Fibonacci sequence. On many occasions, we can find patterns that at first glance seem harmonic but with proportions that do not fit with the Fibonacci sequence. These patterns whose proportions do not agree with the Fibonacci sequence are not valid from the point of view of harmonic trading. Therefore, the trader willing to use harmonic patterns has to arm himself with patience until a well-qualified pattern appears.
The goal of using harmonic patterns, as we said, is to find turning points but they can also predict the end of trends currently on the market. When the prediction of the harmonic pattern is not fulfilled, it is very common that the movement against the prediction is aggressive and fast, since despite their precision, these patterns are not perfect (as it happens with any other technical analysis tool). However, this problem has an easy solution by following one of the trading premises: always control the risk associated with any trade and always use stop loss orders.
Also keep in mind that, like any other trading strategy or tool, it can be complemented by others. Thus, it is common for other chart price patterns to occur in the context of a harmonic pattern. In these cases, these other patterns can be used to aid and support the prediction given by the harmonic pattern.
The trading strategy with harmonic patterns can be used in any timeframe, given the fractal nature of the market, although it is important to focus on the chosen timeframe, which will be long timeframes of 4 hours and more to start with.
Entry orders and stop loss using harmonic patterns
Each harmonic pattern gives us a Potential Reversal Zone, or PZR, in the zone around point D. As its name suggests, the PRZ is a zone and not an exact point. This zone is obtained from two measurements: the retracement with respect to the XA wave gives us one level and the retracement with respect to the BC wave gives us the other level that will determine the PRZ zone.
As you may have noticed, the PRZ zone can be wide because point D can be reached at different Fibonacci retracement levels with respect to the BC wave. This can give us a small PRZ or, conversely, a wide PRZ. The PRZ tends to be wider as the timeframe increases. In case of having a narrow PRZ we can enter at any point of the PRZ, normally in the lower level of the PRZ zone in case of short signals or in the upper level of the PRZ in case of long signals. However, if we find a wide PRZ (more than 60 pips could be considered as a wide zone) it is better to wait to see a convincing price reaction in this zone before executing the entry.
Stoploss orders should be set just beyond the nearest Fibonacci level, just above (in the case of bearish patterns) or below (in the case of bullish patterns).
Let’s see an example:
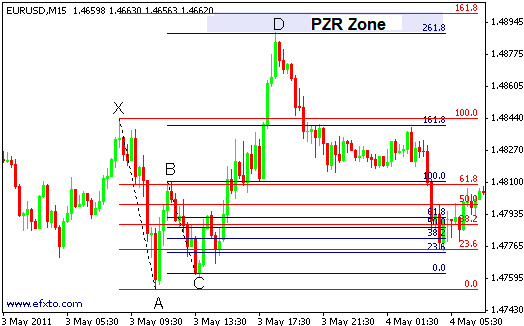
In the image above you can see a bearish butterfly harmonic pattern. Fibonacci retracements in red are plotted for the XA move and Fibonacci retracements in black are plotted for the BC swing. It can be seen how the price, on the rise from point C, reaches the PRZ zone defined between the 261.8% retracement level of wave BC and the 161.8% retracement of wave XA. In this example, the PRZ zone is narrow (between 1.4890 and 1.4900). The sell order was set at 1.4890 with a stoploss at 1.4910. The most effective exit strategy is based on supports and in this case, a first take profit level can be placed on point B.
In summary, harmonic patterns are a precise tool for building a trading method that is based on graphical patterns and Fibonacci sequences. It requires a high dose of patience and deep study of the patterns that must include, at least, the 4 most important: Gartley, Butterfly, Bat and Crab.
I am Raúl Canessa, the founder of Forexdominion.com. As an experienced Forex trader, my passion for investing and algorithmic trading has shaped my professional journey. Over the years, I have dedicated myself to refining my skills in the financial markets, allowing me to share my knowledge and insights through my platform. I am committed to helping others understand the world of trading and develop effective strategies for success in this exciting field.


 Indicator")

