In this article we are going to focus on the topic of trend continuation price patterns. We will cover many topics related to technical analysis such as basic concepts, description of trend continuation formations, and tips on how to trade once the trend continuation pattern is found. In this way, we hope to answer the main questions on the subject, especially those related to the identification of these price formations and their use as technical tools to trade in Forex and other markets.
The three pillars of Technical Analysis
Technical analysis is based on three basic principles, which are known as the three pillars of technical analysis, and they are the following:
- Price reflects everything.
- Prices move in trends
- The history repeats itself.
It is essential to understand each of them to really understand what technical analysis is and how it works. Let’s review each principle:
The price reflects everything
It is the most basic of technical analysis. Technical analysts believe that the prices shown by the market already reflect everything behind it, the political, psychological, fundamental causes, etc.
Prices move in trends
It is important to understand that prices are always trending, until there is a significant reversal. The purpose of technical analysis is to identify the trend at the time of its formation, or in its early stages, as well as the possible end of the current trend.
History repeats itself
Many scholars of the subject believe that this goes hand in hand with trading psychology, since in certain (or many) situations, the market, which is controlled by humans, reacts in the same way, so, in effect, history is repeated. For this reason, we can also assume that what has worked in the past in response to these reactions will work in the same way in the future.
Types of trends in Technical Analysis
In technical analysis, and depending on the complexity of the consulted article, we can find many “types” of market trends. The truth is that it seems that each expert is giving the trends names according to what they find or by their duration: parabolic, exhausted, short-term, intermediate, etc. With their names it is obvious what we can find, but all of these are based on three basic types: Bullish, Bearish and Horizontal trends. And these are the three basic types of trends that we can base our market analysis on.
Bullish trend
It is not difficult to understand what the uptrend line looks like, the maximum prices are getting higher and higher, and the small falls or price corrections that we find in the price chart (because prices do not move up or down constantly) are also increasingly rising (higher lows).
Bearish trend
It is the opposite of the uptrend, the minimum prices are getting lower and lower, and the small peaks that appear along the trend also reach lower and lower prices.
Horizontal trend
This type of trend is known as a lateral trend. It is not totally flat, as prices are moving up and down, but they are moving in a narrow range and there is no clear extensive movement in a bullish or bearish direction.
What are Supports and Resistances in Technical Analysis?
The supports and resistances are basic concepts in chart technical analysis. In general, they are key levels in the history of the market that we are analyzing, either because the trend has ended in these price levels several times (up or down), because the price levels where the supports or resistances are located are difficult to cross, because they represent a psychological barrier, etc.
A support is a price barrier in a bearish direction, that is, it “supports” the price, and it is a price level that really tests the strength of the bear market. If it is passed, other support will come, logically at lower levels.
A resistance is a barrier that acts when the price goes in an upward direction, it “resists” that the price continues to rise and, like its counterpart, tests the strength of a bull market. There is not always a certain resistance level after a previous resistance is overcome, because if all-time highs are reached, we will not really know which level will represent a barrier.
Trend patterns in Technical Analysis
Now that we know what resistances and supports are and what types of trends exist, the next step is to learn about the chart price patterns. These formations can be divided into trend reversal formations and trend continuation patterns.
Trend continuation formations are chart price patterns that indicate that the trend is highly likely to continue, after a period of interruption or lateral trend in the market.
Unlike trend-continuation formations, trend reversal patterns indicate that after the formation of the figure or pattern, the trend will change, and therefore the opposite position to the previous trend must be taken. We will review some of the more popular trend continuation formations later. Also, we will see some trend reversal patterns.
Trend Continuation Patterns
Among the most common trend continuation formations we find the rectangle, triangles, wedges, the cup and handle and others, which we will see later.
A trend continuity pattern is always more accurate when formed in the early stages of a trend. If they form when the trend is in its later stages or exhausting, their chances of success are much lower. Recall, trend continuation formations show a break or pullback in the trend, but no reversal is expected.
These price patterns are important for identifying trading opportunities for both short and medium term traders. Trend continuation formations can provide useful information on what may happen next regardless of the time frame of your trades. It is clear then that if a trend continuation pattern forms in an upward trend, there is a probability that it will continue sooner or later. If, on the contrary, the trend continuation pattern forms in a downtrend, prices will fall after a certain time.
The Rectangle Price Pattern
The rectangle price formation is one of the most basic trend continuation patterns in technical analysis and is made up of two horizontal lines that delimit the movements of price action (support and resistance). The rectangle describes a horizontal trend where supply and demand are more or less in equilibrium for a good period of time and prices therefore move in a range. In this period, the price does not have enough force to break neither the resistance nor the support. Depending on its duration, it may be more of a square and not a rectangle. Let’s look at an example of a rectangle pattern in Forex:

A rectangle pattern was formed on this price chart of the USD/SEK currency pair that lasted from January 28, 2018 to March 28, 2018. Exactly two months. We see how later the price broke the resistance and, days later this same level served as support.
There are two methods of trading this trend continuity pattern. The first can be buying the support and selling the resistance, with a stop loss of a few pips above the support or below the resistance in the event of an unfavorable breakout. The other method is to wait for the breakout (with an increase in volume) and follow the trend. If the breakout follows the direction of the previous trend, the trend continuity pattern forecast is fulfilled.
Triangles as Trend Continuity Patterns
Triangles in technical analysis are common price formations that most of the time act as continuation patterns. Although they can function as continuation or price reversal patterns, it is more common for them to behave as continuation patterns. There are three types of triangles in technical analysis: symmetric, ascending, and descending.
Let’s look at an example of an ascending triangle in technical analysis:

Triangles in the market are formed when price action narrows as the market swings up and down. If trend lines are drawn above the highs and lows of the price action, the price lines converge with each other, creating the appearance of a triangle.
Wedge trend continuation patterns
Wedge patterns are other basic price formations in technical analysis. They have the peculiarity that the price usually breaks in the opposite direction to where the wedge points. That is, after a descending wedge, there is a greater probability that the price will break upwards while in an ascending wedge, the price is more likely to break lower.
In the following image we have a price chart of the USD/JPY currency pair with an example of a descending wedge, where the price started to rise after the pattern breakout:
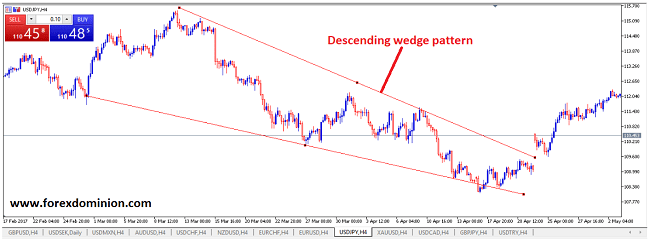
While the slope of the wedge is not that steep, it is clear that the trend was bearish and it developed from March 10 to April 21, just over a month. Exactly on April 23, the price immediately rose and closed well above the closing price of the previous period. Although not shown in this image, the trend prior to this wedge pattern was clearly bullish, confirming its potential as a trend continuation formation.
To trade with this figure, consider a buy trade after the upward breakout, and put an SL at the same level as the first resistance we find within the falling wedge.
Continuation pattern cup with handle
Among the trend continuation formations we find the Cup with Handle chart pattern. It is exactly what the name suggests, a price formation that resembles the side view of a cup and its handle. This trend continuity pattern is one of the most basic trend continuation formations. The cup is shaped like a “U”, and the handle has a slight downward inclination. Given its status as a trend continuation pattern formed mainly in uptrends, it is used to identify new buying opportunities, even if the trend is already started.

The more “U” -shaped the cup pattern is, the higher the chances that it will act as a trend continuation formation. Ideally, the cup should not be extremely deep, and the pattern should not be “V” shaped. Figures with handles that appear to touch the bottom of the cup should also be avoided. The volume should be kept low in the deepest parts of the cup and increase when the price rises and tries to break higher, in the right part of the cup near the handle. To trade this trend continuation pattern, we must buy when the price breaks the top of the handle. The stop loss should be placed around the bottom of the handle.
This same pattern, but reversed, can also be used as a trend continuation pattern in the case of bearish trends, but the cup would be reversed, that is, it would be an inverse “U”, and the rest of the assumptions would also be the reverse.
Rounding Bottom Pattern
The rounded bottom chart pattern is somewhat similar to the cup with handle, however this formation is not part of the trend continuation patterns as it indicates a possible change in trend. It is usually formed in a downtrend, when the price bars are arranged so that they resemble a soup plate, and then the price bounces to initiate an uptrend. Let’s see:

In this example with the GBP/JPY currency pair, we see how the trend was clearly bearish, and the mentioned pattern began to form. The volume increased each time there was a bullish movement, that is, a movement opposite to the trend, until finally the final bullish breakout above the end of the pattern occurred. We describe this formation here for illustrative purposes because it does not count as one of the trend continuation patterns.
To trade this formation, you have to buy when a breakout occurs once the pattern completes. The Stop-Loss should be placed at a level close to or equal to the end of the rounded bottom pattern.
Trend continuation patterns: Summary and conclusions
Technical analysis in financial markets is an approach dedicated to breaking down and analyzing price charts. Technical analysts assume that everything involved in the revised instrument is already reflected in the price. This is the first pillar of technical analysis: Price reflects everything. There are also two other essential pillars for these traders: Prices move in trend and history always repeats itself.
Based on these pillars, technical analysts have been looking for price formations on the charts to study how prices behaved after these patterns. If history repeats itself in theory, these patterns should reappear, and what happened to price behavior in the past would have to happen again. Trend continuation patterns and trend reversal patterns can be found. There are multiple trend continuation patterns such as the rectangle, the triangles, the cup and handle and other.
Along with trend-following patterns, technical analysts also rely on the basic trend (be it bullish, bearish, or sideways), as well as support and resistance. If in the past a price level has proven difficult to overcome, it becomes a resistance or a support. This mixture of studies between the patterns formed, the support and the resistance, have created a series of rules for technical analysts that tell them how they should trade when a certain scenario is repeated. From these principles, countless other studies have emerged that have made technical analysis practically an art and of course, a profession.
I am Raúl Canessa, the founder of Forexdominion.com. As an experienced Forex trader, my passion for investing and algorithmic trading has shaped my professional journey. Over the years, I have dedicated myself to refining my skills in the financial markets, allowing me to share my knowledge and insights through my platform. I am committed to helping others understand the world of trading and develop effective strategies for success in this exciting field.


