In this article, we will present a modified indicator for MT5 called HighLow Zones, which plots the high/low price levels of the previous day, previous week, and previous month. These are price zones where interesting price action often develops, such as breakouts of highs and lows or bounces.
Additionally, the indicator includes a signal screener—a dashboard that shows which trader-selected instrument is breaking upward to a new high, downward to a new low, or trading within the range. It is also designed to plot lines marking the start of the major market sessions (New York, London, and Tokyo).
Finally, the tool includes an alert window feature that essentially displays the signals shown in the signal screener.

The indicator can be downloaded for free using the link provided at the end of the article. The only thing we ask is that if you share this indicator with someone else, you let them know where you obtained the tool.
Features of HighLow Zones for MT5
Although it’s a fairly simple indicator, it’s also highly customizable. By default, it plots lines corresponding to the previous day’s high and low. Depending on the trader’s settings, the indicator can also display:
- The previous week’s high and low.
- The previous month’s high and low.
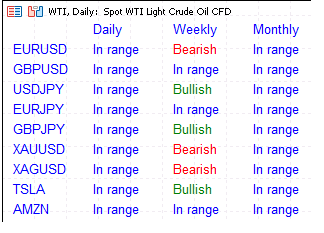
- A signal screener showing which currency pairs are breaking a detected high or low.
- A signal alert window.
- Traders can also customize the colors of the high and low lines, as we’ll see in the settings section.
The following image shows the signal screener in detail:
Regarding the signals window, it appears below:

In the alerts window, the indicator displays the currency pair (market) and whether there was a bullish or bearish breakout of a daily, weekly or monthly high or low level. It also shows the breakout level, meaning the value of the high or low that was breached.
Now let’s look at how to configure the indicator – what we can modify in this tool:
Indicator Configuration
The following is the indicator window:
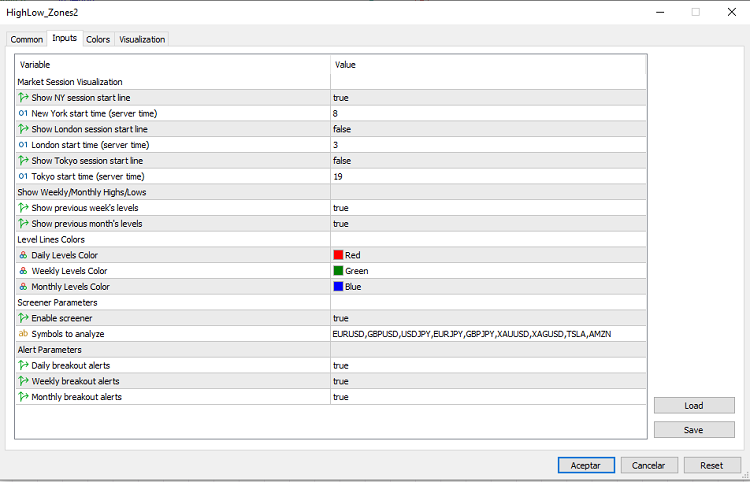
As we can see in the image above, we can instruct the tool to display vertical lines marking the start of the New York session, London session, and Tokyo session.
We can also configure it to show the high and low levels of the previous week and month, since by default the indicator only displays the previous day’s high and low.
Traders also have the option to change the colors of the lines corresponding to highs and lows.
Next, we can enable the option to display a signal dashboard showing which currency pairs have broken the previous day/week/month high/low levels or which pairs remain within the range formed by these levels. Here, traders can add as many instruments as they wish, as long as they are offered by their broker.
Finally, the indicator allows activation of signal alerts that notify when one of these price levels has been crossed.
Recommendations
The indicator is quite simple and, while not a trading system itself, can help develop custom strategies based on breakouts of highs or lows, for example, or counter-trend bounce structures.
For instance, a common strategy when trading stocks is to buy when the price breaks above the previous session’s daily high. To make this strategy safer, many traders wait for a price pullback to the high zone before placing a buy order, protecting themselves against pullbacks or false breakouts that could cause significant losses.
Finally, it’s recommended to combine this indicator with other technical tools like moving averages, oscillators, or volume indicators to validate breakout or bounce signals.
Where can I get this indicator?
As mentioned earlier, this is a free indicator that can be downloaded at no cost via:
You can access a complete list of free modified indicators for MT4 and MT5 platforms in the following section of the site: List of Custom Indicators For Metatrader
I am Raúl Canessa, the founder of Forexdominion.com. As an experienced Forex trader, my passion for investing and algorithmic trading has shaped my professional journey. Over the years, I have dedicated myself to refining my skills in the financial markets, allowing me to share my knowledge and insights through my platform. I am committed to helping others understand the world of trading and develop effective strategies for success in this exciting field.


