MetaTrader 4, the most known and used platform for Forex trading has a lot of tools and options which are little known and used primarily by ignorance. This is due largely to the fact that very few users read the manual built into the platform. In this article we will see some of these options and utilities unfamiliar. (Much of what is described below applies equally to Metatrader 5).
Market watch window
The Metatrader platform, newly installed, does not show all instruments available to trade on the broker, but a few. You can see in the market watch window the list with several interesting options.
If you want to see all currency pairs available just click with the right mouse button on the Market Watch window and choose “Show All“. You can sort the list by “drag and drop”, click on any symbol and drag it to the desired position and release. However, to have the complete list of all the instruments that you can access through your broker is not very good idea as Metatrader download the ticks and quotes from each. To reduce traffic consumed by the platform is not a bad idea to limit the number of instruments shown in this window leaving only those you really use.
Tip: right click on the market watch window, choose “Hide all”; thus only those instruments that have open charts are displayed in this window. You can also select the symbols that you want to show through the menu “Market Watch” -> “symbols” (here we can access “Properties” of each symbol and see important info as swap, stop levels, etc).
If you use a large number of symbols you can organize them into groups to organize more efficiently the Market Watch window. For example, if you trade in currencies and indexes, you can make a group called Forex and other called index; or you can make a group with the major pairs and other with the exotic pairs … or whatever you want. To create a group right click on the Market Watch window to access the menu and go to “Sets” -> “Save as …” a group with existing symbols are created. The group created now appears in the “Profiles” menu where you can go by changing the group.
To quickly display a symbol in the Market Watch window double-click on an empty area and you can write the name of the symbol, press enter and the symbol will be displayed immediately.
Traffic Reduction of Metatrader
Reduce the traffic consumed by Metatrader can be useful in many cases. The first option that we have is use the Market Watch window appropriately leaving only the symbols we really use as described in the previous section. Another option to reduce traffic on the platform is disable the news, which hardly anyone uses. To do this go to the top menu “Tools” -> “Options” and here, in the “Server” tab, uncheck the “Enable news” box.
Put several indicators in the same window of another indicator
In Metatrader is possible to put several indicators in the same window of indicators, for example, you can put a moving average on the MACD window. You can even put two MACD in the same window and with different parameters. Thus, the trader puts an indicator of other indicator, which is useful for some trading strategies. To do so just do a “drag and drop”: go to the list of indicators in the “Explorer” window, click the indicator you want, drag and drop it in the window of any indicator that you activated previously.
Transaction history on the chart of a currency pair
If you drag&drop an operation from the account history to a price chart, it will show graphically where the trade was opened , where the trade was closed and a line joining the two points, similar to what we see when an EA opens and closes trades. You will also see stoploss and takeprofit levels who had the trade through small lines drawn in the same vertical line as the beginning of the order. If you drag and drop an order from the account history to a chart of a different pair, the chart will change to the currency pair corresponding to the selected order.
Something far more interesting: drag an order to a chart of the same currency pair and hold down the shift key, you’ll get all the transaction history of the currency pair in a graphical way. You will be surprised how this can be instructive about your style of trading.
Quick navigation between dates and times in charts
To use this utility is recommended that you disable the autoscroll, otherwise you will go to the current date and time at every new tick. Once the autoscroll is desactivated, press the enter key; a square will appear where you can write the date, time, symbol and timeframe that you want to check. Once written confirm your choice by pressing Enter again. You can change the date and time or symbol and timeframe. This option can be very useful in full screen mode, which is accessed by pressing F11.
Instrument and timefrane example:
- Instrument: EUR/USD.
- Timeframe: M30
- Instrument and timeframe: they must be separated by commas. Example: EURUSD, M30
Date and time example:
- Date: in numeric format dd.mm.yyyy. Example: 13.08.2015. This would be August 13, 2015.
- Time: hh: mm. Example: 16.15. This would be 4 pm quarter.
- Date and time: Example: 13.08.2015 16:15.
Charts dispositions in Metatrader
If you are someone who keep many price charts open probably at some point you will need to sort all these graphs. You can do this without having to close them and open them again in the desired order. To sort the graphics in the graphics window, click the name of the instrument corresponding to the chart you want to move and drag and drop in the place you consider appropriate.
Rates window
Pressing F10 a window with the price quotes of all pairs that are being displayed on the market watch window opens. In the context menu of this window you can change the font and text color of this window and you can select “Always on top” so that this window will never hide and will never appear behind of Metatrader or any other program opened in your PC. In this way you can monitor the price quotes while you work on other things, surfing the Internet or watching a movie.
Change the default template
Each new graphic you open in Metatrader opens with certain characteristics. You can have your own template and select it but to do the job faster Metatrader offers the possibility to change the default template to fit your needs. To do this, once you have a chart with your indicators, colors and timeframe, right click on it and go to “Template” -> “Save template” and save it as default.tpl.
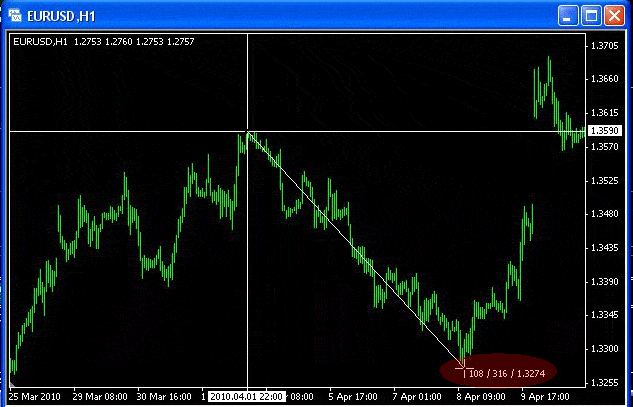
Ruler to measure the distance in pips and number of candles between two points on the price chart
This is a very useful tool. To use this tool activate the “crosshair” by clicking the middle mouse button or pressing Ctrl + F. Once you have the crosshair active left click on the first point and hold, them drag to the second point. You will see the following information close your mouse pointer: number of candles/number of pips/Bid price of the second point.
Rapid modification of an order
To access the modification of an order quickly go to the “Operations” window and double-click on the stoploss or takeprofit (if you double click on any other point of the “Operations” window, the window for sending a new order will open).
Partial close of an order
Surely you have ever heard of the partial closure of an order, did you think that you could not do it in Metatrader 4? The fact is you can and easily. To partially close an order in Metatrader you need to access the close order window (right click on an order and select Close Order) and here you change the lot size by the number of lots you want to close of the order. For example if the order is 1 lot and we modify the order lot size to 0.5 in the closing order window, then 0.5 lots of the order will be closed and 0.5 lots will remain open.
Passwords in MT4
In MetaTrader 4 there are two types of passwords, the trader password (the principal) and passwords for investors. Investors can access your account and view open positions, the account history, balance, etc., but they can not open, close or modify trades, ie, they can only look but not trade.
- Trader Password change: Go in the top menu to “Tools” -> “Options” and activate the “Server” tab. You will see a button that says “Change”, click this button and you can change the trader password by selecting “Change Master Password” (on the box “Old Password”).
- Change/creation of investor password (read only): To create a password in read-only mode or change the existing one, you need to perform the above procedure but in this case select the “Change investor password (read only) option.
Note that in both cases there must be connection to the server, if there is no connection the user can not modify or create any password.
Using Trailing Stops
Metatrader has incorporated a trailing stop tool. This tool only works when the platform is connected to the server because it change continuously an order so it needs to communicate with the broker. To activate the trailing stop tool click on an order in the trading window, go to the “Trailing Stop” option and select the number of pips you want for the trailing stop. For example, if you select 15, it will move the stop loss of your order at a distance of 15 points from the current price of the currency pair, always forward, and if the price moves back the stoploss is not changed until the time comes when the market price reaches the stop loss level. The first change will occur when the trade reaches a greater benefit than the number of pips specified in the trailing stop.
Copy lines and objects
If you draw a trendline in the chart you can copy and move this line to draw a channel very easily. To do this select the line by double clicking on it. Once selected the line, click and hold the mouse and the Ctrl key and drag to the place where you want to drop the copied line. You can do the same with other objects such as text objects.
Graphic images
If you want to get the image of a price chart right click on it and select “Save image as …“. Choose the image options appropriate to your purpose and click Save. With this simple procedure you will have an image of your price chart in an instant.
Recover lines, objects and charts eliminated
If you’ve ever accidentally closed a graph indicators, lines and other objects of analysis, or you deleted a line, channel or the like in a chart, you can easily retrieve them without having to do it all over again.
- Recovering of a closed chart: In the top menu of Metatrader go to “File” -> “Open Deleted” and you will see a list of the latest price charts you have closed. Select the one you want to recover and the platform will reopen the chart with everything it had. It works even if you close your Metatrader platform and open it again.
- Recovery of deleted lines and objects: You can retrieve deleted objects and lines of a chart by pressing Ctrl + Z. This option does not apply to indicators. With this tool we can recover lines and objects in the current session Metatrader; that is, if you close and open back the platform you can not recover lines and objects previous to the new beginning.