Reversal trading system based on Keltner channels and Bollinger Bands

The trading system that we will explain below is based solely on two indicators, the Keltner channels, and the Bollinger Bands, which are actually quite similar. It is a price reversal system that tries to find the price inversion points.

Therefore, it works best in range markets where extreme value readings of indicators such as Bollinger Bands produce more reliable results. In trending markets where it is more difficult to predict maximum or minimum extreme values, their signals have less reliability.

Since this system uses two well-known and commonly used indicators found in any technical analysis package, it can be used in any trading platform.

Read more

Channel breakout system with retracement for Forex

This trading system was primarily designed to trade in extended time frames (4 hours later). It is based upon the breakout of a dynamic price channel which is calculated through the highs and highs of the price bars. In this sense, the strategy seeks to enter the market after two events occur:

  • The bullish or bearish breakout of the price channel.
  • A retracement movement of the price after the channel breakout. After this setback, the trader must open a position in the same direction as the breakout.

NR4/IB strategy for intraday trading

The NR4/IB trading strategy is an intraday trading system which was developed by the traders Lawrence A. Connors and Linda Bradford Raschke and presented in their book “Street Smarts“. The meaning of the letters NR4/IB is “Narrow Range Bar 4Bar/Inside” and each time this pattern is detected there is a high probability that the market will produce a strong movement after the breakup of the formation. This pattern consists of a series of four bars or candles in which the fourth candle has two very important conditions:

  • Condition 1: The last bar or candle (also called NR4) must have a minimum and a maximum lower than those of the three previous bars, which means that it is a narrow bar as it is trapped within the range of the previous bars.
  • Condition 2: The NR4 bar must not exceed the maximum or minimum of the bar that precedes it, which makes it what is known as the “inside bar”.

Read more

How to trade false breakouts in the markets?

Trade false breakouts in a simple way

The trading techniques based on breakouts are very popular because they are quite profitable and can be used to trade in any market.  Many traders know the fact that after the price get caught into an area of consolidation a breakout usually occurs by which the price make a violent and extensive movement outside the area where it was consolidated.

These movements could be so strong that a trader can obtain high profits if enters the market in the right direction. However, the problem is that in many cases the traders who jump when there is what appears is a breakout realize the fact that the price returns to the area of consolidation and ends losing money. This is known as a fakeout or false breakout.

In fact, the fakeouts are so common that many investors trade and make money with strategies based on false breakouts. Therefore, in this article we will show the basic way to trade false breakouts.

Read more

Simple Breakout Trading Strategy


Introduction

This strategy is quite simple, nothing new really. It’s basically a simple method of breakouts based on two premises:

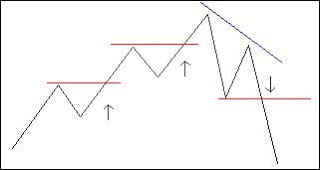
-When an asset is in a strong bullish/bearish trend it tends to stay in that way unless there is something in the market that makes the price change its direction. In the Forex market,for example, there are often major trends that last for weeks and months which can be used to trade with the breakouts that occur in the support/resistance. If the market is bullish we must look for breakouts of resistance but if the market is bearish we must look for breakouts of support.

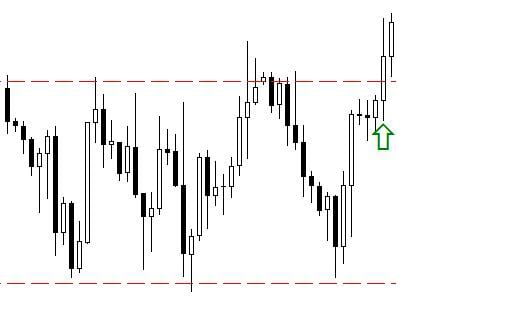
We can see an example of this in the picture below:

Read more

Vegas Tunnels Trading Strategy for 1 Hour Charts

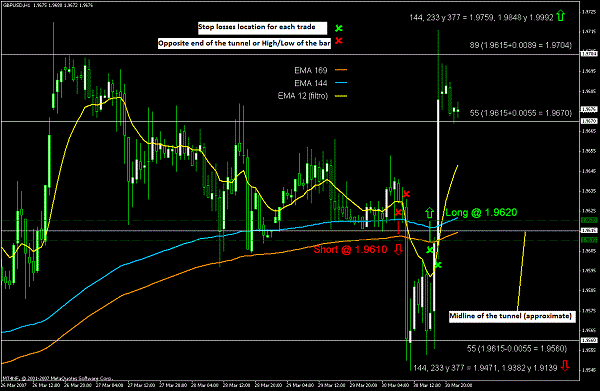
This is a trading system developed by Vegas to trade only in 1 hour price charts. Basically this trading technique is to open three equal positions (if the trading platform permits the trader can also open a position divided into three parts which can be closed independently). Another option is to divide the capital invested in the trade according to percentages, for example the first position corresponds to 50%, the second position to 25% and the third position to 25%. Each trader can decide how to work with each position.

It can be used in many markets, including Forex (any currency pair), precious metals (gold and silver), indices and other.

The methodology of this system is quite simple. Initially three exponential moving averages (EMA) are plotted on 1 hora chart:

Read more

Master Candles Trading Strategy

What is a Master candle?

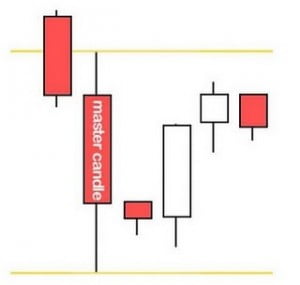
First at all we are going to describe what is a master candle. Basically these are candle with big bodies and wicks (the sticks over and under the bodie of the candle) marking a new high or a new low and whose extension or range covers out the following 4 or more candles. To better understand the concept of master candles we can observe the following image: