The Awesome Oscillator (AO) is a technical indicator developed by Bill Williams which determines market momentum (the second of the five dimensions of the market according to Williams) at a specific time based on the last five bars, which momentum is compared with the momentum of the last 34 bars.
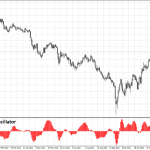
In this way the Awesome Oscillator is simply the difference between the simple moving average of 34 periods and the simple moving average of 5 periods which are calculated based on the midpoints of the bars (High + Low) / 2. The Awesome is displayed on the graph as a histogram:

This indicator is usually found in most trading platforms including Metatrader 4 and Metatrader 5. In Metatrader each bar of the histogram which is greater than the previous bar is green, while each bar which is smaller than the preceding bar is red.
Buy signal “Saucer” of the Awesome Oscillator
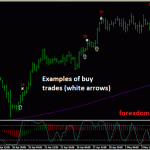
The buy signal “Saucer” of Awesome Oscillator is generated when the histogram is above zero line and changes its direction from downtrend to uptrend.
In this case, the bar “A” of the histogram, regardless of color must be greater than the bar “B” of the histogram. Also, the bar “B” of the histogram should be red while the bar “C” (signal) of the histogram should be green.
Once the signal has been generated, place a Buy Stop order one point above the price bar that corresponds to the bar “C” of the histogram.
The most recent “Saucer” signal always cancels previous signals (we cannot forget to cancel all pending orders once the signal is canceled). It is important to keep in mind that we only buy if the current histogram bar is green and sell only when the current histogram bar is red.
Sell signal “Saucer” of the Awesome Oscillator
The sell signal “Saucer” of the Awesome Oscillator is the opposite of the buy signal which was described above. This signal is generated when the histogram of Awesome Oscillator is below the zero line and changes its direction from upward to downward as shown in the following example:

Buy/Sell signal for the crossing of the zero line by the Awesome Oscillator
A buy or sell signal is generated whenever the histogram crosses the zero line either from the bottom up (buy signal) or from above to below (sell signal) as shown in the image below:

Trading Signal “Twin Peaks” of the Awesome Indicator
The Twin Peaks buy signal is in fact the only buy signal that occurs below the zero line. Similarly, the Twin Peaks sell signal is the only sell signal produced above the zero line.Once the signal is generated, place a Buy Stop order (or Sell Stop order) one point above the high (or one point below) of the price bar that corresponds to the bar of the histogram that gives the entry signal to the market. In the case of a buy signal, the bar “C” (signal) of the histogram should be green while in the case of sell signal the bar should be red.


