The Chande Momentum Oscillator (CMO) was developed by Tushar Chande, who presented it in a co-written work with Stanley Kroll called “The New Technical Trader”. This indicator was designed to calculate what Chande refers to as “pure momentum”. The objective of this indicator is to detect trend variations of greater or lesser extent. The CMO is similar, although it is unique in itself, to other indicators oriented to momentum such as the Relative Strength Index (RSI), Stochastics, and Rate-of-Change.
The CMO uses data from both bullish days and bearish days in the numerator, directly measuring the momentum. The calculations are developed with non-smoothed data. This allows extreme short-term movements to be less hidden. However, smoothing can be implemented to the Chande Oscillator if desired. The scale of the indicator is between +100 and -100 allowing the user to clearly see changes in market momentum using level 0 as a balance point.
Calculation of Chande oscillator
Structurally, the CMO is similar to the RSI, its only difference being the inclusion of the term Sd (x) in the numerator of the formula.
For a period of “x” bars:
RSI = 100 * (Su / (Su + Sd))
CMO = 100 * ((Su – Sd) / (Your + Sd))
Where:
Su = Sum of the price differences on bullish days.
Sd = Sum of the price differences in bearish days.
But this simple modification is, in Chande’s opinion, of the utmost importance, since in this way the CMO is able to capture what he calls “pure moment” resulting, in general, being more sensitive to changes.
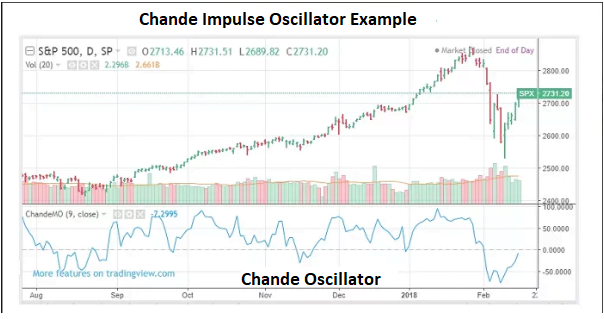
The following image shows a price chart of the S&P 500 where the Chande oscillator was applied:
Chande Oscillator Features
As already stated, this oscillator is similar to other momentum indicators such as the Relative Strength Index (RSI) and the Stochastic Oscillator, except that it measures momentum in both bullish and bearish periods. This, coupled with the fact that it also does not use any smoothing, causes this oscillator to reach oversold and overbought levels more frequently. The indicator oscillates between +100 and -100.
An asset is considered overbought when the Chande oscillator is above the +50 level and oversold when it is below the -50 level. Many technical traders add a 10 period moving average to this oscillator which acts as a signal line. In this way, the oscillator generates a bullish signal when it crosses above the moving average, and a bearish signal when it crosses below the moving average.
The oscillator can be used as a confirmation signal when it crosses above or below 0. For example, if a trader notices that the 50-period moving average has crossed above the 200-period moving average (which known as the golden cross), could confirm the buy trade if the Chande oscillator has crossed above the 0 level; this would suggest that prices were showing upward momentum.
The strength of the trend can also be measured using the Chande oscillator. The higher the oscillator value, the stronger the trend; the lower the value, the weaker the trend.
Interpretation of the Chande oscillator
This indicator can be used to measure different conditions:
- Identify overbought/oversold conditions: looking for extreme overbought or oversold market conditions is the primary CMO interpretation method. As a general rule, Chande oscillator identifies an overbought level at +50 and the oversold level at -50. At +50, the momentum of a bullish day is three times the momentum of a low day, while at the -50 level the momentum of a bearish day is three times the momentum of a bullish period. These levels essentially correspond to the common 70/30 levels for the RSI indicator.
- Chande oscillator with a signal line: entry and exit rules can be created with the CMO by adding a moving average in the Chande oscillator. For example, we can use a CMO with a configuration of 20 periods and a moving average of 9 periods (SMA 9) that can serve as a good signal line. In this case, we must buy when the CMO crosses over the signal line of the SMA 9 and sell when the indicator crosses below this moving average.
- Trend Analysis: The CMO can also be used to measure the degree of a current trend exhibited by an instrument. High or extreme CMO values correspond to a strong trend while low values indicate a possible trading range.
- Divergence between the indicator and the price: although it is not specifically mentioned in Chande’s book, seeking divergences between the CMO and the price of the instrument can also be a viable strategy as it is usually with other similar indicators oriented to price momentum.
Finally, another interesting application of the CMO is its use in the construction of adaptive moving averages with great sensitivity to changes in volatility. Such is the case of the VIDYA (Variable Index Dynamic Average), but this will be the subject of further articles.
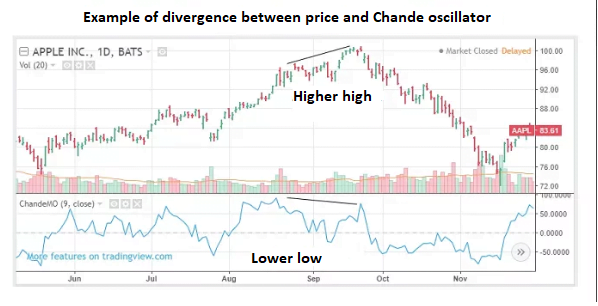
Divergences between the price and the Chande oscillator
Traders can use the Chande Momentum Oscillator to spot positive and negative divergences between the indicator and the price of the underlying asset. A negative divergence occurs if the underlying price is trending up and the Chande oscillator is moving down. A positive divergence occurs if the price is falling, but the oscillator is rising.
In the example below, Apple Inc. hit a new high in late August and another new high in late September. The oscillator, however, reached a lower high in late September, confirming a negative divergence. Traders who decided to open a short position on Apple stock could place a stop-loss order above the September swing high and close the trade when the oscillator crosses below -50.
Chande Oscillator for Metatrader 4
Chande oscillator is not among the built-in indicators for Metatrader 4 as it is not very well known. However, as with many other unpopular technical indicators, there are modified indicators for MT4 developed by traders and programmers that display the Chande oscillator on any price chart and time frame on this trading platform.
For example, we have the CMO_v1 indicator for Metatrader 4, which displays the Chande oscillator in a window below the chart, as the following image shows:
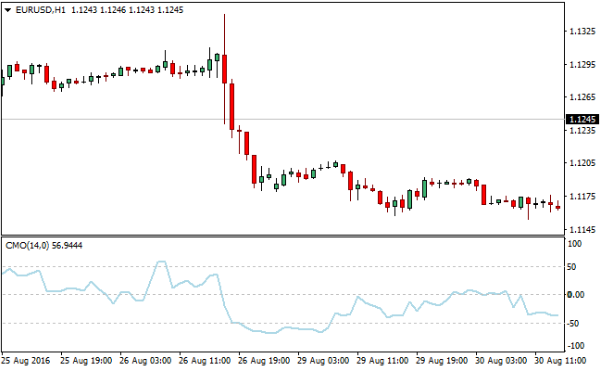
-Download CMO_v1 indicator for MT4
I am Raúl Canessa, the founder of Forexdominion.com. As an experienced Forex trader, my passion for investing and algorithmic trading has shaped my professional journey. Over the years, I have dedicated myself to refining my skills in the financial markets, allowing me to share my knowledge and insights through my platform. I am committed to helping others understand the world of trading and develop effective strategies for success in this exciting field.
 Indicator")


 - Main Features")
