The Flag and Pennant strategy for trading binary options is a chart-pattern based strategy, like most of the other such strategies out there. What sets it apart from the majority of these schemes though is the fact that the Flag and the Pennant pattern are rather difficult to spot, for beginners and advanced traders alike.
With that in mind, it’s safe to say that the actual identification of the above said patterns is one of the main goals and components of this strategy. How one can then use these patterns to trade is actually quite self-explanatory.
 |
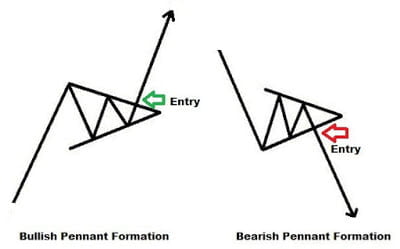
| Bullish and bearish pennant |
The first thing one has to understand about flags and pennants is that they’re continuation patterns. What that means is that their presence indicates a continuation of a previous trend in the same direction. The flags and pennants are therefore price-breaks, representing periods during which profit-taking occurs, before the trend resumes.
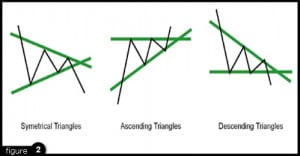
Technically speaking, there’s no difference between flag and pennant patterns. The trend lines traced at the highs and lows of the pattern are parallel in the case of flags, and they converge in the case of pennants, hence the names. There are bearish flags, which represent breaks in a downward trend, and bullish ones, which are essentially price-breaks in an upward trend.
Now that you know what flags and pennants are, it’s time to get down to identifying these rather ubiquitous yet so difficult-to-spot patterns.
The key to identifying flags and pennants is to spot profit-taking on charts. Profit taking results in a short period of retracement, which will end up forming the flag or pennant part of the pattern. The flagpole is the actual trend before the retracement occurs. Once the trend lines are traced and the flag pattern is essentially drawn up, the trader has to watch for a break out of the pattern, which is the first indication of the resumption of the previous trend.
Traders who find it difficult or impossible to identify such trends can use pattern-recognition software to aid them in spotting the flags and pennants. There are all sorts of such programs out there, some of them available for free, others for a one-time fee or subscription.
When it comes to identifying patterns, one always has to keep in mind that there are usually certain errors associated with manual identification. Some of the pattern-identification programs available out there are so good that they completely eliminate these errors.
Now for the actual trade: the flag/pennant pattern strategy can be used for the Touch/No Touch as well as the Call/Put trades.
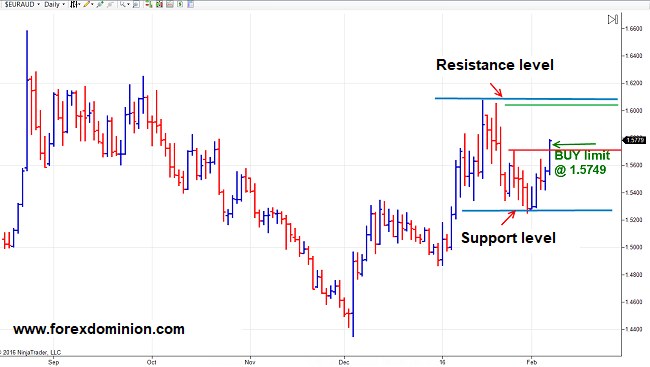
In order to best illustrate how the actual trades need to be placed, let’s consider a bullish flag pattern. Once the pattern is drawn up, it quite clearly defines the No Touch zone for the trade, which is below the pennant/flag. The breakout candle at the end of the flag pattern, which –as said above – marks the start of the resumption of the dominant trend, is the critical point in the strategy. Everything above that candle belongs to the Touch Zone, and that is where the Call trade should be placed as well.
Now then, for the trade expiry, one has to consider the actual time-frame used for the analysis. If it’s an hourly chart you’ve used, the expiry on the Call contract should be set to at least 6 hours, in order to give the trend plenty of time to accomplish what it’s set out to do.
Obviously, with bearish flags and pennants, only the Call contract can be traded (in addition to the Touch/No Touch trades of course). To trade the Put contract, one will need to find a bearish flag or pennant. Everything said above is valid for the Put trade, in reverse.
The bottom line: in capable hands, the flag/pennant approach is an efficient weapon indeed. Remember: the critical part is the actual identification of the pattern(s). Also: use a demo account to put your flag/pennant skills to the test before going for the real McCoy.


