In this article we finish the series on daytrading and scalping strategies based exclusively on price action applicable to Forex and other markets, we hope you have liked it.
These strategies are based on the identification of classic price patterns from technical analysis.
You can access the third article in the series at the following link: The Best Forex Daytrading Strategies III
Day Trading Strategy # 16: (Inverted Ascending Triangle with Momentum in the Center of the Range)
-Price pattern detected: Inside an inverted ascending triangle formation an Inside Day occurs preceded by a bullish candlestick with a wide range that closes near the highs (bullish case) or a bearish candlestick with a wide range that closes near the lows (bearish case).
-Entry order type:in the bullish case we place a buy stop order above the inside bar maximum. in the bearish case we place a sell stop order below the inside bar minimum. If after a few hours the price does not reach the stop order, we will cancel the order.
-Profit Target: Our exit point will be located on the opposite side of the inverted ascending triangle.
-Stop Loss: The stop loss is placed at a level that allows a benefit/risk ratio of 2:1 or higher.
Example of the strategy in the CHF/JPY
In this example, an Inside Day is formed within an inverted ascending triangle after a strong bullish candlestick that traverses a range of over 300 pips and closes near the highs. We put a buy stop order slightly above the Inside Day high at 123.68 with a target around 126.00 (top of the triangle) and stop loss at 122.70. The benefit/risk ratio is 2.3 to 1.
Day Trading Strategy # 17: (Descending Triangle with Inside Bar)
-Price pattern detected: In the consolidation of a bearish breakout in a descending triangle pattern an Inside Day is formed.
-Entry order type:We place a sell stop order below the Inside Day low. If after a few hours the price does not reach the stop order, we will cancel it.
-Profit Target and Stop loss: The stop loss and take profit should be placed at levels that offer a benefit/risk ratio of 2:1 or higher.
Example of the strategy in the GBP/USD
After the downward breakout of a descending triangle and the subsequent consolidation, an Inside Day occurs. We place a sell stop order below the low of this last candlestick at 1.5080 with a take profit target of 1.4900 (low of the candlestick preceding the Inside Day) and a stop loss at the high of the Inside Day above 1.5150. The benefit/risk ratio is 2.6 to 1.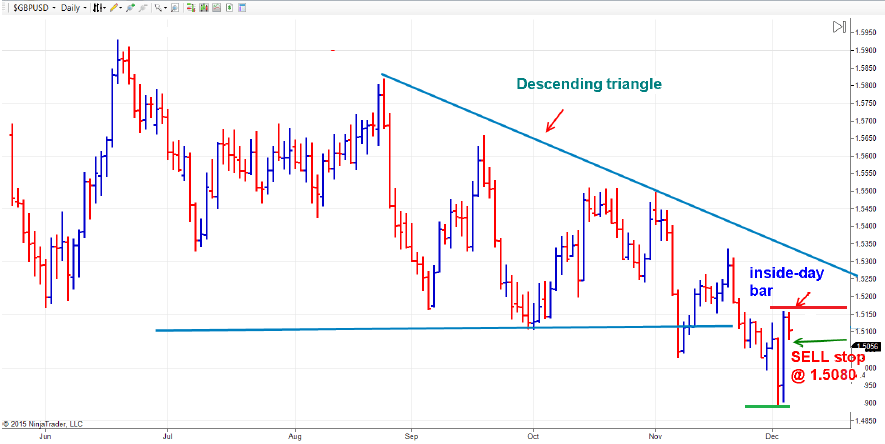
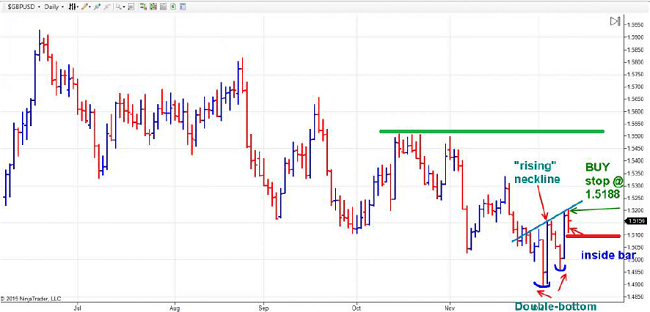
Day Trading Strategy # 18: (Double Bottom Pattern with an Ascending Baseline and Inside Day)
-Price pattern detected: An Inside Day candlestick is formed at the end of a Double Bottom with an ascending baseline.
-Entry order type: A buy stop order is placed above the maximum of the Inside Bar. If after a few hours the price does not reach the stop order, the trading order is cancelled.
-Profit Target: Our exit point will be located at the next support or resistance. We can also take advantage of the descent or rise projection of the Double Bottom pattern.
-Stop Loss: The stop loss is placed at a level that allows a benefit/risk ratio of 2:1 or higher.
Example of the strategy in the GBP/USD
An Inside Day is formed after a double bottom pattern with an ascending baseline is produced. We place a buy stop order slightly above the Inside Day high at 1.5188 with a profit target around 1.5525 (next resistance) and stop loss below the Inside Day low at 1.15100. The benefit/risk ratio is 3.9 to 1.
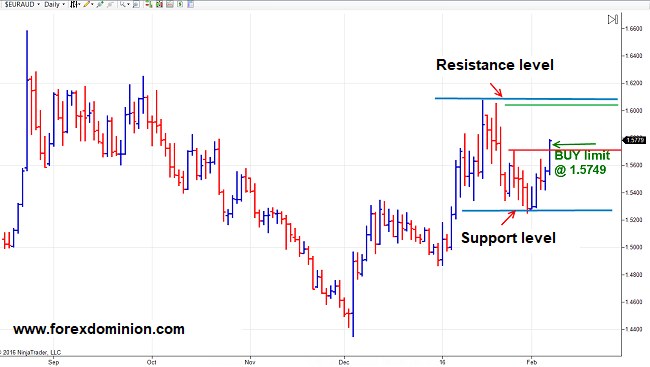
Day Trading Strategy # 19: (Consolidation pattern in Flag pattern with Reversal Bar)
-Price pattern detected: After a strongly directional candlestick is formed, with a wide range and close near highs (bullish case) or near lows (bearish case) a corrective flag formation is formed. While the pattern develops a Reversal type candlestick is formed.
-Entry order type: In the bullish case we place a buy stop order above the maximum of the Reversal Bar, while in the bearish case the entry order will be a sell stop order below the minimum of the Reversal Bar. If after a few hours the price does not reach the stop order, we will cancel it.
-Profit Target: Our exit point will be located at the next support or resistance.
-Stop Loss: A stop loss is placed at a level that allows a profit/risk ratio of 2:1 or higher.
Example of the strategy in the EUR/JPY
After a strong bullish candlestick that takes the price from 129.50 to 134.50, a flag correction begins. An Inside Day occurs after a double bottom with an ascending baseline is formed. We place a buy stop order slightly above the Reversal Bar high at 133.25 with a profit target around 135.00 (next resistance) and a stop loss below the Reversal Bar low at 132.50. The benefit/risk ratio is in this case 2.3 to 1.
Day Trading Strategy # 20: (Double Top/Bottom Pattern with Rebound after Price Attack on Support/Resistance)
-Price pattern detected: This advanced pattern consists of a double top (bottom) that stops before a support (resistance). After the price is rejected, it corrects and forms an Inside Day or a NR4 type candle (that is, a candlestick with the lowest range of the last 4 sessions).
-Entry order type: In the case of the Double Top pattern and subsequent stop in the support area, we will place a sell stop order below the Inside Day or NR4 minimum. On the other hand, in the case of the Double Bottom and subsequent stop in the resistance zone, we will place a buy stop order above the Inside Day or NR4 maximum. In both cases, if after a few hours the price does not reach the stop order, we will cancel it.
-Profit Target: Our exit point will be located at the next support or resistance.
-Stop Loss: The stop loss is placed at a level that allows a benefit/risk ratio of 2: 1 or higher.
Example of the strategy in the AUD/USD
A double top is formed in the 0.6900 zone. The price then breaks the pattern to the upside but stops at the 0.7400 level, forming a clear resistance. After a downward correction from the resistance zone, the price forms an Inside Day. We place a buy stop order slightly above the Inside Day high at 0.7197 targeting the resistance level (0.7400) and a stop loss below the Inside Day low at 0.7110. The benefit/risk ratio stands at 2.3 to 1.
Day Trading Strategy # 21: (Double Top/Bottom Pattern with Symmetrical Triangle and Inside Day)
-Price pattern detected: After confirmation of a double top or double bottom pattern, a symmetrical triangle is formed. In that case we are looking for an Inside Day to try to take advantage of the continuity of the movement started in the double top/bottom pattern.
-Entry order type: In the case of the double top pattern, we will place a sell stop order below the Inside Day low, while in the case of the double bottom we will place a buy stop order above the Inside Day high. In both cases, if after a few hours the price does not reach the stop order, we will cancel it.
-Profit Target: Our exit point will be located at the next support or resistance.
-Stop Loss: The stop loss is placed at a level that allows a benefit/risk ratio of 2:1 or higher.
Example of the strategy in the USD/JPY
After a double top is confirmed a clear symmetrical triangle is formed. Inside it we observe an Inside Day. Here we place a sell stop order slightly below the low at 119.78 with a price target at the support level at 118.00 and a stop loss slightly above the bearish trendline of the symmetric triangle at 121.00. The benefit/ risk ratio does not reach 2: 1, so this operation would probably be ruled out.


