The creator of Andrews Pitchfork was an American named Alan H. Andrews, who based much of his thinking on cycles, especially Newton’s III Law applied to economics. This principle indicates that for each force acting on a body it exerts an equal but opposite force on the body that caused it. This well-known principle of physics was applied by Andrews in his trading and in fact, he gave a seminar called “Action-Reaction Course“, which allowed him to earn a lot of money.
In this course, Andrew presented a methodology that made it possible to decompose the market trend by dividing it into two equidistant channels which in the graph looked similar to a trident, hence the name of this technique.
Content
What is Andrews’ Pitchfork?
It is a channel-based technical analysis technique that uses three parallel lines to determine possible support or resistance pivot zones.
These three lines are drawn after the identification of three points at the end of an established trend, where the price changes direction.
Once the three points are identified, the pitchfork is drawn (this tool appears in all trading platforms and graphical analysis packages). It can be expanded by adding other parallel lines, based for example on Fibonacci indicators.
In theory, and taking into account what Andrews published, once the trident is identified, 80% of the time the price will go to its centerline, and the remaining 20% it will fail, and the resulting movement will cause a pivot breakout of the lower or upper trend line, if the position indicated by the Pitchfork is bullish or bearish, respectively.
How to build the Pitchfork?
To construct the Andrews Pitchfork we must apply the following steps:
- First, the trader must identify a turning point either maximum or minimum that is important in the trend, which is designed as Point A.
- Then the trader must draw a line (in this case red) from point A to the next major turning point which we denote as Point B
- The next step is to draw a line from a pivot point that is meaningful and that marked the beginning of the current trend (this point is designated as C). This line should cut in half the line joining the points A and B. This new line is designated as the mid-line or the handle of the Pitchfork which is forming in the graph.
- Finally the trader must draw two lines that are parallel to the midline, and must pass through points A and B. With this we have the Pitchfork ready as presented in the following price chart (click on the image to see a larger size).
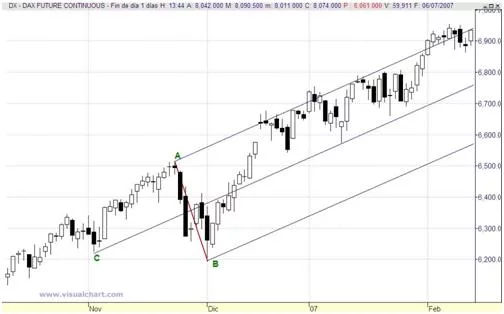
In the picture above we can see a price chart in which is drawn an Andrew´s Pitchfork. In this case, the lines that form the Pitchfork contain the price movements as these rise during an uptrend. The following are the main rules to trade with the Andrews Pitchfork:
How to trade with the Andrew’s Pitchfork?
Here are three basic rules to consider when we trade with the Andrew´s Pitchfork:
- The trading principles of the Andrew´s Pitchfork (and other trading techniques based on tridents) is similar to that used to trade with trendlines. First, we look for the possibility of a turnaround in the market whenever the price is close to any of the lines that form the Pitchfork The more turns are produced in the vicinity of the lines, the greater the force that these lines have as resistances or supports.
- According to Andrews, 80% of the time the price tends to return to the midline. If this happens, usually it’s best to wait for the price to make a major move in the opposite direction. Remember that the lines which form the Pitchfork usually act as resistances/supports, especially the midline.
- Conversely, if the price comes out of the channels that form the Pitchfork, we consider that this is a trend change.
A problem of this trading technique is that there is no definitive rule for choosing the significant points, therefore the selection of these points is quite subjective. Besides the picture may be complicated if you draw several tridents.
However, this methodology has proven successful for many traders that have included the Andrews Pitchfork among their usual strategies.
Trading ideas inside Andrew´s Pitchfork
The Andrew´s Pitchfork is a very useful tool to draw price channels, which help to identify the main market trend and areas in which we can enter the market.
By itself, this tool may be somewhat limited on some occasions, but if we draw the Andrew´s Pitchfork and add horizontal support and resistance zones, along with typical price indicators, such as Fibonacci retracements, then things change quite a bit.
By using several indicators and important price zones in conjunction with the Andrew´s Pitchfork, we can find confluence zones with multiple signals that point in the same direction.
Therefore when applying this tool with other technical indicators we can do the following:
- We have some relevant pivot price points, A, B and C that allow us to draw the Pitchfork.
- Once the Pitchfork is drawn, we have channels that set the trend for us, and on which we can trade in favor of the trend.
- We look for possible entry points in favor of the trend and based on the channel determined by the Pitchfork, but taking into account other technical signals: horizontal supports or resistances, Fibonacci retracements, Japanese candle patterns, etc.
Every trader must find the unique combination of indicators and technical tools that produces the best results. Here we have just presented some ideas that you can apply when using Andrews Pitchforks.
The easiest way to present the three-point determination rule, indispensable for drawing the Andrews’ Pitchfork, would be by using terminology from Elliott’s Wave Theory. The first reference point is the main turning point, the start of a new trend. The second reference point marks the end of the first impulse wave. The third reference point establishes the end of the first correction.
Trading outside the Andrews Pitchforks
We have already shown how the trend lines formed by the Andrews Pitchfork (Channels) can be useful for making investment decisions, but also outside the pitchfork we can find good trading signals to make decisions.
n the following chart, we see an interesting bullish pitchfork formed between June 2012 and June 2014.
The breakout of the pitchfork ‘s bullish trend line created a very good sell signal, suitable for opening a bearish position.
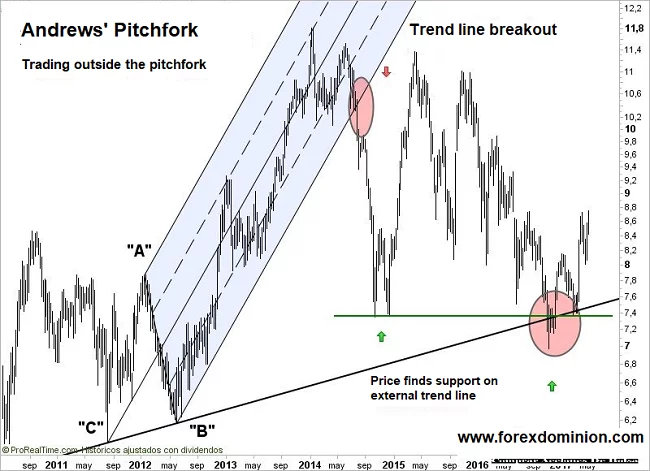
If we now draw a bullish trend line, with the C and B points of the bullish pitchfork, we see how the area where the price has rebounded, is a feasible area to have taken long positions.
The idea of buying at the November lows is supported by several signal confluences, such as that it is a support area that has already worked in the past.
Andrews pitchfork in combination with technical indicators
To support trading or investment decisions, we can use Andrews’ pitchfork in combination with technical indicators.
In the following example, we are going to combine the pitchfork with the MACD, one of the most widely used oscillators in technical analysis.
At point 1, we could have opened buy positions, since there were signs that indicated it.
We were at the low of the trident, the price is above the support zone that had previously been a resistance. The MACD rose above level 0, a typical bullish indicator signal.
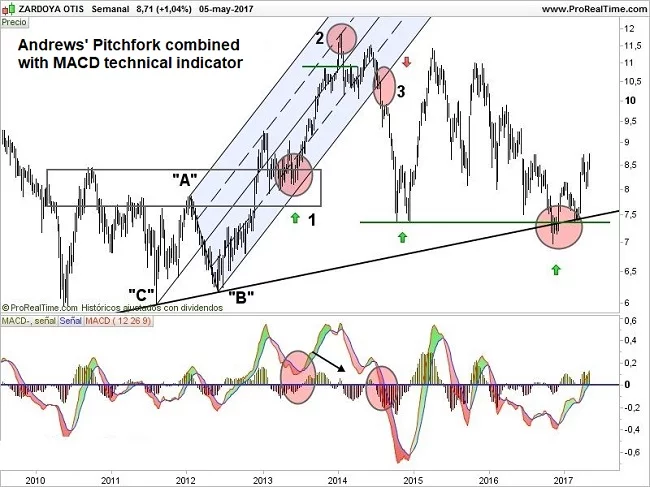
In point 2, it would have been advisable to take profits. The price reaches the top of the channel, and the MACD indicator does not accompany the price, there is no obvious “super” divergence, but we can see that the trend is running out of steam.
In point 3 you should look for the opening of short positions. Definitely, the price breaks the trend line of the bullish channel, and the MACD indicator enters negative territory.
I think that with this article you will have discovered a new tool, which can be very useful, but I also want you to keep something essential in trading, you have to use signal combinations … and good money management.
Conclusions
Andrews’ pitchfork can be used to predict how a new trend can evolve based on the location of the first three reference points. However, you can experiment with drawing the pitchfork based on any other reference point, without necessarily having to apply the procedure described above. In this case, if we decide to do it, our analysis will be more subjective and the risk of error will increase.
I am Raúl Canessa, the founder of Forexdominion.com. As an experienced Forex trader, my passion for investing and algorithmic trading has shaped my professional journey. Over the years, I have dedicated myself to refining my skills in the financial markets, allowing me to share my knowledge and insights through my platform. I am committed to helping others understand the world of trading and develop effective strategies for success in this exciting field.


 Indicator")


