Elliot Waves Theory – Offering Great Predictions!
Description of Elliot Waves Theory
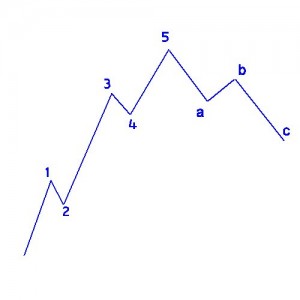
Bullish module 5-3. Basically, this theory states that the market has a complete bullish cycle formed by a first bullish stage made by 5 waves called 1, 2, 3, 4 and 5 where the wave 3 tends to be the greatest of all but never the less, the wave 3 always exceeds the value of the wave 1. The second stage, a bearish stage, consists of 3 waves called a, b, c (abc correction waves). Each stage has its own impulsive waves and corrective waves. The impulsive waves are those that are in the direction of the trend and the corrective waves are those that go against the trend. In the first bullish stage the waves 1, 3 and 5 are also rising, so they move in the trend direction and are considered impulse waves, however, the waves 2 and 4 are not bullish so these are considered as corrective waves.
In the bearish stage, the waves a and c are bearish and move in the direction of the trend, so these are considered bearish momentum waves. On the other hand, the b wave is bullish and go against the trend, therefore it is considered as a corrective wave.

- Grand Supercycle – decades to several centuries.
- Supercycle – several years to several decades.
- Cycle – one year to several years.
- Primary – a few months to a year.
- Intermediate – several weeks to months.
- Minor – weeks.
- Minute – days
- Minuetto – hours
- Subminuette – minutes
Description of the five waves that compose the pattern
The five waves described by Elliot waves theory are the following:
- Wave 1: The wave 1 rarely expresses its intention, so few people can identify it. When the first wave of a new bull market starts the fundamental news is extremely negative. The previous trend is considered very strong and fundamental analysts are revising their estimates downward, the economy is very weak. The polls are decidedly pessimistic. Abound put options. Implied volatility in the options market is high. The volume may increase slightly with rising prices, but not enough to alert technical analysts.
- Wave 2: Wave two corrects wave 1 but never extend beyond the starting point of wave 1. Normally, the news remains bad. As prices return to near the previous low, it also returns the negative sentiment. “The crowd”, is still thinking that the market is in a downtrend. Still, there are some positive signs: The volume should be lower than in the development of wave 1 and the reverse should not exceed the 61.8 Fibonacci. Prices fell during this phase describing a pattern of three waves.
- Wave 3: Normally this is the longer and more powerful wave of a trend (although some research suggests that in commodity markets the wave 5 is usually the largest) The news began to be positive and the fundamentalists are beginning to make income estimates. Prices rise rapidly and corrections are very weak. Surely someone will be looking for a “pullback” and stay off the ship. When the wave 3 begins the news may continue to be pessimistic and many investors keep their short positions. However, at the height of the midpoint of the wave 3 (the point of Prechter) “the crowd ” will join the new uptrend. Wave 3 is often extended to a ratio of 1.618:1.
- Wave 4: This wave is also clearly corrective. Prices tend to meander for a long time and reverse back to the 38.2 of the wave 3 (usually less). The volume is approximately the same as the volume in wave 3. So if we are very familiar with the theory we can intuit that this is a particularly important point to take advantage of wave 5 and its potential. For example, if we infer that the way could be extended (this could be analyzed in another article). Another important feature is that wave 4 is usually hard to count.
- Wave 5: Wave 5 is the last part in the direction of the main trend. Right now the news are extremely positive and everyone is optimistic. Unfortunately, this enthusiasm will lead many novice investors to buy just before the market reaches the top. The volume in wave 5 is less than wave 3 and many indicators start to show divergences (prices reach new highs while the indicators fail to reach new highs). At the end of a bull market, the “bears” are often ridiculed. Just remember how was received the forecast of a stock market top in 2000.
- Wave A: Corrections are typically harder to identify than impulse moves. In wave A of a declining market generally, the fundamental news are still positive. Most analysts see the drop as a correction in a bull market that is still active. The technical indicators accompanying the wave in its movement. Volume increases, the volatility in the options markets and possibly the interest in related Futures markets also increases.
- Wave B: The prices move upward again by what many see as a revival of the bull market that still they do not believe is over. Those familiar with technical analysis may see this peak as the right shoulder of the chart pattern Shoulder-Head-Shoulder. The volume should be less than Wave A. The fundamental news may not yet negative.
- Wave C: The price falls, forming five waves. The volume is triggered and in the subwave 3 of the wave now everyone understands that the market is in a downtrend. Wave C is at least as large as the wave A and often extends in 1.618 … or more.
How to count Elliott Waves?
In fact, in Elliot waves theory the waves count is a matter of much practice and lots of art. Did I say art? Yes, in my opinion, the interpretation of Elliot waves can be extremely subjective. The structure of the Elliot waves is repeated indefinitely whether you study a superstructure or you study a lower substructure. That is why is always possible to find a way to match the Elliott waves with the chart that is being studied. However, this does not mean that the Elliot waves are not valid because for me it is a valuable tool to predict movements in the market and find entry and exit points of the market with either gains or losses.
The most I can do here is to give the 3 basic rules which, together with the characteristics of each wave described above and a lot of practice, will help you identify each wave. These 3 rules are widely accepted and recognized and used to skip any of these rules means that the wave count is incorrect:
- The wave 2 will never go below the minimum of Wave 1 if there is an uptrend, or above the high of Wave 1 if there is a downtrend.
- Of the three impulsive waves (1, 3 and 5), the Wave 3 is never the less.
- The Wave 4 will never end in the area of Wave 1, except in some rare cases in which there is a rising wedge (if the market is in an uptrend) or a bearish wedge (if the market is in a downtrend). This wedge is neither more nor less than two converging lines (not parallel or divergent) none of them horizontal.


