Indicator parameters
- Alerts= false
- GMTshiftSun = 1.0
- GMTshift = 0.0
- pivot= true
- StandardPivots = true
- ListStandardPivots = true
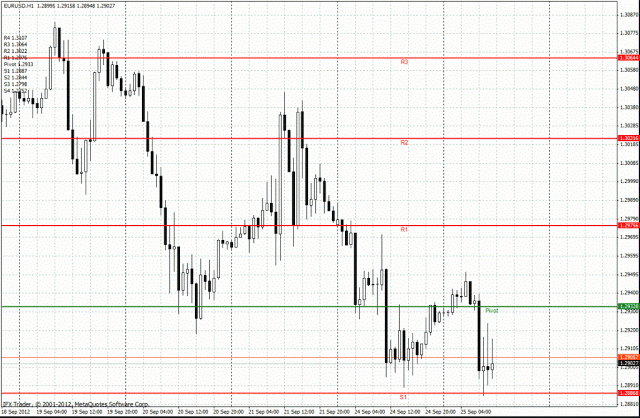
It is an indicator designed to show daily Camarilla pivot points on any Metatrader chart. It is based on the famous Camarilla equation, an alternative method to calculate Pivot Points, which lets you determine a central pivot point (PP), four levels of resistance (R1, R2, R3 and R4) and four levels of support (S1, S2, S3 and S4). This indicator calculates and automatically adds all these price levels in the chart.

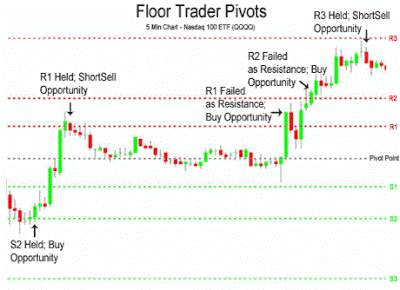
The trader can use the levels calculated by the Equation Camarilla to determine market direction more objectively, to set profit-taking price targets, and perform trades based on price reversals or price breakouts through of any of these levels. For example, some common trading strategies with these pivot points are:
- Open long positions available on S3 or short positions on R3 since the price tends to reverse at these levels.
- Open long positions if the price crosses R4 or short positions if the price crosses S4, as it is considered that if the market has reached those levels, something very important has happened that has driven the price in an upward or downward movement as strong.
In any case, Camarilla levels (pivot, resistances, and supports) calculated by this indicator represent price zones at which the trader must pay attention as the price can rebound or break these levels.
You can download this indicator for Metatrader 4 and 5 using the following link:


