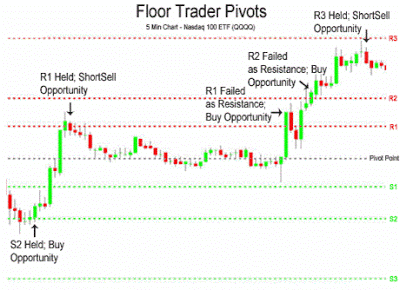
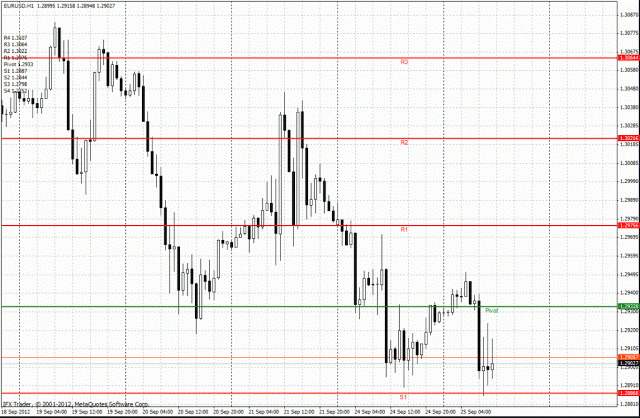
Pivot points are a valuable tool for traders as they allow the calculation of support and resistance levels that can be used as a reference point to develop an entire methodology or approach to trading in the market.
Another popular method for calculating pivot points is Woodie’s Pivot Points, which were developed by Ken Wood. In this approach, the closing price has a greater influence compared to other similar methodologies. Many traders believe that the maximum and minimum prices of a period are mostly the result of emotions generated in the heat of the battle, while the opening and closing prices are a more accurate representation of the market’s mood.
The formulas used for calculating Woodie’s Pivot Points are as follows:
R4 = R3 + range of the previous period
R3 = High + 2 x (PP – Low) (equals R1 + range of the previous period)
R2 = PP + range of the previous period
R1 = (2 x PP) – Low
PP (Pivot Point) = (High + Low + (Current period’s Open x 2))/4
S1 = (2 x PP) – High
S2 = PP – range of the previous period
S3 = Low – 2 x (High – PP) (equals S1 – range of the previous period)
S4 = S3 – range of the previous period
In this case, High and Low specifically refer to the maximum and minimum prices of the previous period, respectively. Similarly, R1, R2, R3, and R4 are four resistance levels, PP is the pivot point, and S1, S2, S3, and S4 are four support levels. The range is the difference between the High and Low of the previous period.
Although pivot points (whether Woodie’s or other types) can be applied to any time frame (1 hour, 4 hours, 1 day, 1 week, 1 month, etc.), they are generally used primarily to analyze the market on the daily time frame, corresponding to one trading day. In these cases, High and Low specifically refer to the maximum and minimum prices reached by the analyzed instrument in the market during the previous day, while the Open of the current period corresponds to the opening price of the current trading day.
If we analyze the formulas above, we can see that one key difference in calculating Woodie’s pivot points is that the opening price of the current period is used in the Pivot Point (PP) formula along with the high and low of the previous period. Additionally, none of the formulas use the closing price of the previous period, which is a key difference from traditional pivot points, for example.
To calculate the corresponding support and resistance levels, the formulas use the difference between the maximum and minimum prices of the previous session, known as the range.
Real Example of Woodie’s Pivot Points Usage
The best way to demonstrate the difference between Woodie’s methodology and other forms of calculating pivot points is through an example. In this case, we will calculate traditional pivot points and Woodie’s pivot points for the session on February 24, 2013, in the EUR/USD currency pair. Since daily pivot points are being determined, we will use data from the session on February 23, 2013, corresponding to the maximum price, minimum price, and closing price.
- High: 1.3680
- Low: 1.3520
- Close: 1.3545
According to the classic formula, to calculate the pivot point, we simply need to add these three price levels and divide the result by 3:
– (1.3680 + 1.3520 + 1.3545)/3 = 1.3581
In the case of Woodie’s methodology, the formula to calculate the pivot point is more complex and takes into account the maximum and minimum prices of the session on February 23 and the opening price of the session on February 24. The data used is as follows:
- High: 1.3680
- Low: 1.3520
- Open: 1.3545
In the Forex market, it is not uncommon for the closing price of a session to be equal to the opening price of the next one, as this market operates 24 hours a day without interruption, unlike stock markets, for example.
The Woodie’s formula requires adding the sum of the maximum and minimum prices of the previous session to double the opening price of the current session, and then dividing the obtained result by 4:
-(1.3680 + 1.3520 + 2 x 1.3545)/4 = 1.35575
As mentioned earlier, we can see that the most recent price receives more emphasis in Woodie’s formula for calculating the pivot point. Something similar occurs with exponential moving averages, for example, where the most recent closing prices carry more weight in the calculation compared to previous closing prices.
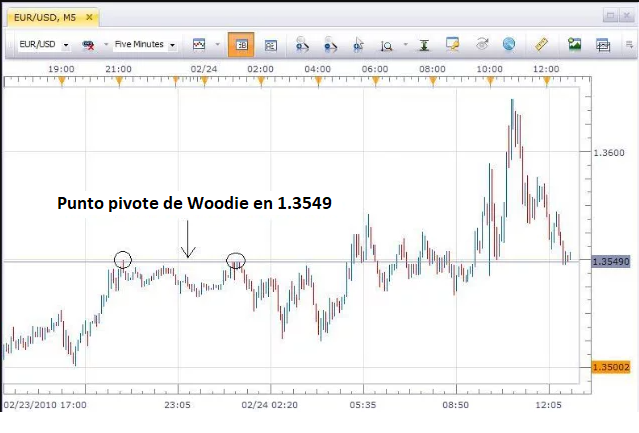
The following image shows a 5-minute chart of the EUR/USD for the session on February 24, with Woodie’s pivot point added at 1.35575. This level acts as resistance to the price movement until a strong bullish breakout occurs due to the release of a significant scheduled economic report from the United States. The market opened below the pivot point, so initially, the trader had a bullish bias, meaning that selling trades were likely the preferred option until the breakout at 1.35575 occurred.
Here is another example of Woodie’s Pivot Points applied to the EUR/USD. Woodie’s pivot point, support levels, and resistance levels are indicated by solid lines, while the dashed lines represent levels calculated using the traditional method.
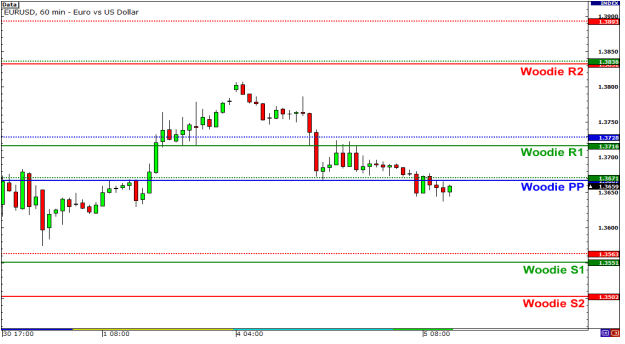
As we can see, since both methods use different formulas, the levels obtained through Woodie’s formulas are quite different from those calculated using the standard method.
Some traders prefer using Woodie’s Pivot Points precisely because they give more weight to the opening price of the current period. Others prefer standard pivot point formulas because many traders use them, which often leads to self-fulfillment due to the large number of traders buying or selling at the same price levels.
In any case, since resistances can turn into supports and viceversa, if a trader chooses to use Woodie’s formulas, they should stay informed about these price levels, as they can become areas of interest.

