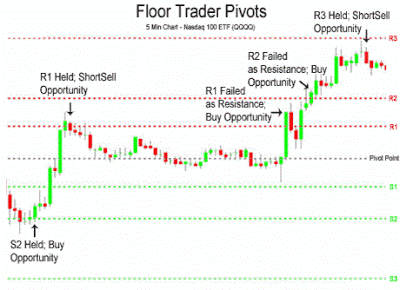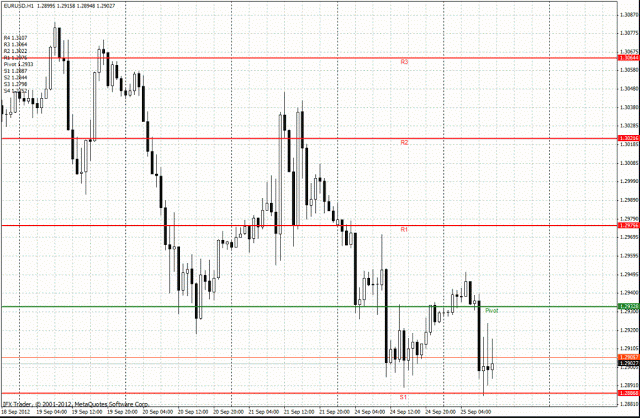
Traders use pivot points to help determine potential entry and exit points for trades. For example, if the price of an asset is approaching a pivot point level that is also a resistance level, traders may consider selling the asset as the price is likely to encounter selling pressure at that level. Conversely, if the price is approaching a pivot point level that is also a support level, traders may consider buying the asset as the price is likely to find support at that level.
Pivot points are most commonly used in intraday trading, but they can also be used for longer-term trades as well. There are several different methods for calculating pivot points, including the standard method, the Woodie’s method, and the Camarilla method, among others.
Pivot Points Calculation
To calculate the pivot points to trade the next market session, you need the high (H), low (L), and close (close) of the previous session. The pivot point is simply the average of the high plus low plus close, or (High + Low + Close) / 3. The Support 1 level is calculated by multiplying the Pivot by 2 and then subtracting the previous day’s high. The Resistance 1 level is calculated by multiplying the Pivot by 2 and then subtracting the previous day’s low. The secondary support (S2) and the level of resistance (R2) are calculated using the numbers (P, S1, and R1). And finally, support 3 (S3) and resistance 3 (R3) are calculated using the numbers (P, H, L). The general formulas are the following:
- Resistance 2 (R2) = P + (H – L)
- Resistance 1 (R1) = P + (P – L)
- PP (P) = (H + L + C) / 3
- Support 1 (S1) = PP – (H – P)
- Support 2 (S2) = P – (H – L)
- Resistance 2 (R2) = P + (R1 – S1)
- Resistance 1 (R1) = (P * 2) – L
- Pivot Point (P) = (H + L + C) / 3
- Support 1 (S1) = (P * 2) – H
- Support 2 (S2) = P– (R1 – S1)
- Resistance 2 (R2) = P – (S1 + R1)
- Resistance 1 (R1) = (2*P) – L
- PP (P) = (H + L + C) / 3
- Support 1 (S1) = (2*P) – H
- Support 2 (S2) = P – (R1 + S1)
- Resistance 3 (R3) = H + 2 X (P – L)
- Resistance2 (R2) = P + H – L
- Resistance 1 (R1) = (2 X P) – L
- PP (P) = (H + L + C) / 3
- Support 1 (S1) = (2 X P) – H
- Support 2 (S2) = P – H + L
- Support 3 (S3) = L – 2 X (H – P)
Variants of the Pivot Points
Woodie’s Pivot Points
Woodie´s pivot point system is based on the previous day’s price range and uses different formulas for calculating support and resistance levels compared to the standard method. While Trading Woodie’s pivot points may share similarities with other variations of pivot points, grasping the nuanced distinctions unique to Woodie’s pivot points is crucial to gaining a trading advantage.
The formulas to calculate the Woodie´s pivot point levels are the following:
- PP (Pivot Point) = (High + Low + (2 x Close)) / 4
- S1 = (2 x PP) – High
- S2 = PP – (High – Low)
- S3 = Low – 2 x (High – PP)
- R1 = 2 x PP) – Low
- R2 = PP + (High – Low)
- R3 = High + 2 x (PP – Low)
In this method, the pivot point is given more weightage to the closing price, as compared to other pivot point methods where the closing, opening, and high/low prices are given equal importance. This makes Woodie’s pivot points more sensitive to the closing price, and can provide a better indication of potential levels of support and resistance for traders.
Tom Demark Pivot Points
- If Close < Open, then X = High+2×Low+Close
- If Close > Open, then X = 2xHigh+Low+Close
- If Close = Open, then X = High+Low+2xClose
- New Maximum = X / 2 – Low
- New Minimum = X / 2 – High
Camarilla Pivot Points

- R4 = (High – Low) X 1.1 / 2 + C
- R3 = (High – Low) X 1.1 / 4 + C
- R2 = (High – Low) X 1.1 / 6 + C
- R1 = (High – Low) X 1.1 / 12 + C
- PP (Pivot Point) = (High + Low + Close) / 3
- S1 = C – (High – Low) X 1.1 / 12
- S2 = C – (High – Low) X 1.1 / 6
- S3 = C – (High – Low) X 1.1 / 4
- S4 = C – (High – Low) X 1.1 / 2
More information on the Camarilla pivot points in the following article: The Camarilla Equation
Fibonacci Pivot Points
- PP (Pivot point) = (High + Low + Close)/3
- S1 = PP – 0.382 * (High – Low)
- S2 = PP – 0.618 * (High – Low) R2 = PP + 0.618 * (High – Low)
- R1 = PP + 0.382 * (High – Low)
- R2 = PP + 0.618 * (High – Low)
- S3 = PP – 1.000 * (High – Low)
- R3 = PP + 1.000 * (High – Low)
Note that the Fibonacci ratios used in these formulas (0.382, 0.618, and 1.000) are based on the Fibonacci sequence.
Once you have calculated these levels, you can use them as potential support and resistance levels when trading. If the price of the asset moves towards one of these levels, it can indicate a potential buying or selling opportunity, depending on the direction of the trend. Traders often use Fibonacci pivot points in conjunction with other technical analysis tools to make trading decisions.
More information on the Fibonacci pivot points in the following article: The Fibonacci Pivot Points
How to use pivot points in trading?
Pivot points can be used in trading to help identify potential support and resistance levels for an asset’s price, as well as to determine potential entry and exit points for trades. Here are some ways that traders use pivot points in their trading strategies:
- Support and Resistance Levels: Traders can use pivot points to identify potential support and resistance levels for an asset’s price. The pivot point itself can be used as a level of support or resistance, and traders can also look to the other support and resistance levels calculated from the pivot point (such as S1, S2, R1, R2, etc.) for additional levels to watch.
- Breakouts: Traders can use pivot points to identify potential breakout levels. If the price of an asset breaks above a resistance level calculated from a pivot point, it may indicate a bullish breakout, while a break below a support level could indicate a bearish breakout.
- Reversals: Pivot points can also be used to identify potential trend reversals. If the price of an asset is approaching a support level calculated from a pivot point and begins to bounce off that level, it could indicate a potential trend reversal to the upside. Conversely, if the price is approaching a resistance level and begins to turn down, it could indicate a potential trend reversal to the downside.
- Entry and Exit Points: Traders can use pivot points to determine potential entry and exit points for trades. For example, if the price of an asset is approaching a resistance level calculated from a pivot point and the trader is short the asset, they may consider exiting their position at that level. Conversely, if the price is approaching a support level and the trader is looking to go long, they may consider entering a long position at that level.
What indicators can be used with pivot points?
There are several indicators that can be used in conjunction with pivot points to enhance their effectiveness in technical analysis. Some of the commonly used indicators with pivot points include:
- Moving Averages: Moving averages are used to smooth out price fluctuations and identify trends. Traders often use a combination of pivot points and moving averages to confirm potential levels of support and resistance.
- Relative Strength Index (RSI): RSI is a momentum indicator that measures the strength of a trend. It can be used with pivot points to confirm potential levels of support and resistance.
- Bollinger Bands: Bollinger Bands are used to measure the volatility of an asset’s price. Traders often use Bollinger Bands with pivot points to identify potential levels of support and resistance.
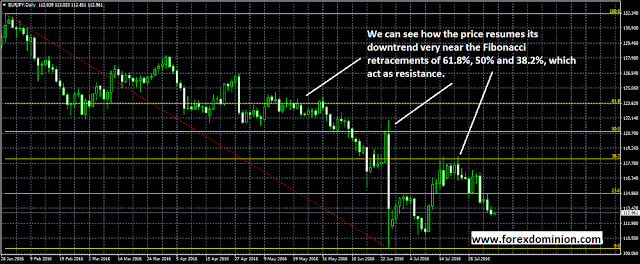
- Fibonacci retracements: Fibonacci retracements are used to identify potential levels of support and resistance based on key Fibonacci levels. These retracements can be used in conjunction with pivot points to confirm potential levels of support and resistance.
- MACD (Moving Average Convergence Divergence): MACD is a trend-following momentum indicator that is often used to identify potential trend reversals. Traders may use MACD in conjunction with pivot points to confirm potential levels of support and resistance.
By using these indicators in combination with pivot points, traders can potentially increase the accuracy of their technical analysis and make more informed trading decisions.
Conclusion
In conclusion, pivot points are a useful tool for technical analysis in trading. They help identify potential support and resistance levels for an asset’s price, as well as potential entry and exit points for trades. Pivot points can be calculated using a variety of methods, including the standard method, Fibonacci method, Camarilla method, Woodie’s method, and DeMark method. Traders often use pivot points in conjunction with other technical analysis tools to make trading decisions.
However, it’s important to note that pivot points are not always reliable, and traders should use caution when relying on them for trading decisions. As with any trading tool, it’s important to have a well-developed trading plan and risk management strategy in place when using pivot points to make trading decisions.


