Summary: In this article we describe the use and calculation of Fibonacci Pivot Points, a little known variant compared with traditional pivot points. The novelty about this tool is that it interestingly combines the pivots and Fibonacci sequence to determine support and resistance levels where there is high probability that the market made major moves.
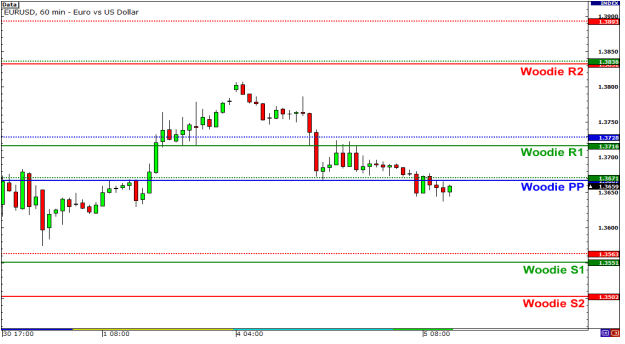
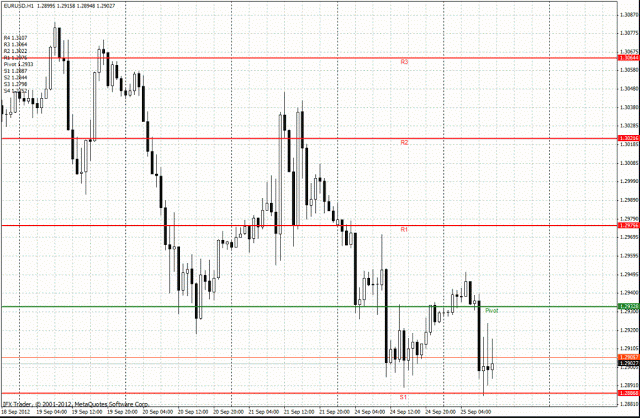
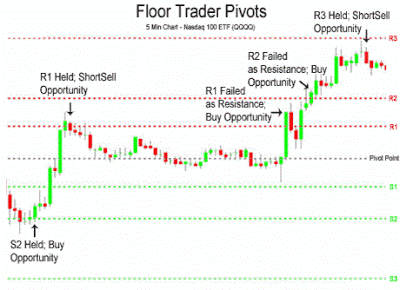
The pivot points in its different variations can be used in two ways: to display the main trend in the market that we are analyzing or to display price levels in which we can open and close a position. To identify the direction, if the price level of the pivot point is crossed in an upward motion, then we can say that the market is bullish, but if the break occurs in a downward movement, then the market is bearish. Generally, if prices remain above the pivot point then the upward trend will continue until an event cause a reverse in the price movement and when the price remains below this level then the market will continue its downward direction until something happens that force a change in the current trend.


