In this article we present a modified indicator for Metatrader 4 designed to plot the KAMA Adaptive Moving Average on any price chart of this platform. It can be modified to show the moving average with different types of prices, such as the closing price, the opening price or the maximum price of each period. Before talking about this modified indicator, we are going to explain what the KAMA moving average is.
What is the KAMA moving average?
KAMA is short for Kaufman’s Adaptive Moving Average. This moving average is designed to automatically adapt to changing trend conditions, thanks to its calculation formula, which is similar to the one used to calculate the exponential moving average (EMA). The difference between the two moving averages is the smoothing factor K, which in the KAMA is determined by a much more complex formula than in the EMA.
This adaptive moving average is designed to better detect sideway markets compared to normal moving averages, as the KAMA is nearly horizontal (no temporary bullish and bearish swings) in non-trending markets. Therefore, it has fewer false signals.
In trending markets, the KAMA follows price action more closely than other moving averages, therefore it is an effective tool for identifying large trend movements.
In summary:
- The KAMA moving average lines up with price action, even when price swings are small, especially when market noise is low.
- After a sideways market, the KAMA realigns itself with the price action as price swings expand and begins to follow the price closely as it rises or falls.
Like other adaptive moving averages like the FRAMA and the VIDYA, the KAMA adapts to different market conditions, be it trend or range conditions, and not only smooths price action like the EMA or WMA which are moving averages that give more weight to the latest prices but do not distinguish range markets from trending markets.
In this sense, thanks to the calculation formula for its smoothing factor, the KAMA reacts more strongly to trend movements while in range markets the reaction degree is reduced.
Uses of the KAMA indicator
The KAMA indicator can be used to determine turning points in the market, detect the general trend and filter the price movements, to refrain from opening positions in the lateral markets, which generate many false signals in trend indicators as the moving averages.
Directional changes in price can be determined by price crossovers above or below the KAMA. However, many alerts and false signals are generated when a simple crossover system is applied, just as with any moving average. False signals can be eliminated by adopting a price or time filter for the crossover.
In any case, it should be used as a complement or additional indicator in a complete trading system, where its signals can be filtered by other indicators that analyze other aspects of the market. The KAMA has the advantage that it offers fewer false signals in lateral movements and acts better as a moving support/resistance level in trend phases.
KAMA Moving Average for MT4
The calculation of this indicator is not excessively complex, although it does require more steps than other moving averages such as the SMA and the EMA. Also, it is not widely known and is not incorporated into most trading platforms such as Metatrader 4. That is why we have developed a free custom indicator that displays the KAMA moving average superimposed on the price action on any chart of our choice.
Although it is a novel trend indicator that has a number of advantages over traditional moving averages, it should not be used as the sole criterion to open or close positions in the market. It is recommended to use it as part of a well evaluated trading system.
The version of the KAMA moving average for Metatrader 4 that we have created is called KAMA.mq4, which can be downloaded free of charge at the end of the article.
The image below shows a price chart on the MT4 platform with the KAMA indicator plotted on the price action.
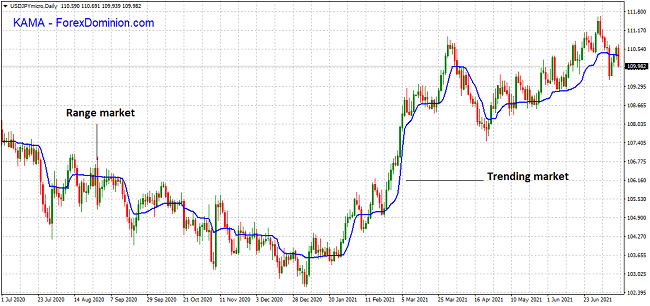
As we see in the image above, the KAMA not only closely follows the price action in trend movements, but hardly reacts to lateral movements. In fact, in these markets there are almost no bullish and bearish movements that can lead to false signals.
This indicator has 4 configuration parameters:
- Efficiency Ratio Calculation Period (Default value: 10)
- Fast Constant EMA Period (Default value: 2)
- Slow Constant EMA Period (Default value: 30)
- Price Applied to the Calculation (Default value: Closing price)
Note: In general, the KAMA calculation uses the closing prices of the analyzed asset. However, in this indicator we include the possibility of calculating the moving average also using the opening price, the maximum price, the minimum price, the typical price and the weighted price.

Otherwise, we use the same formulas and parameters developed by the creator of this indicator.
Download and install the KAMA indicator
This custom KAMA moving average indicator was developed by the ForexDominion.com team and can be downloaded and used free of charge.
The KAMA indicator is installed according to the standard methodology for the installation of indicators on MT4. You can download it at the following link:
You can access a complete list of free custom indicators for MT4 and MT5 in the following article: List of Custom Indicators For Metatrader
I am Raúl Canessa, the founder of Forexdominion.com. As an experienced Forex trader, my passion for investing and algorithmic trading has shaped my professional journey. Over the years, I have dedicated myself to refining my skills in the financial markets, allowing me to share my knowledge and insights through my platform. I am committed to helping others understand the world of trading and develop effective strategies for success in this exciting field.
")


