Mean Reversion Strategies aim to generate profit when prices return to the mean after deviating from it.
A typical example is buying when a stock’s price drops significantly, anticipating a price recovery.
What is a Mean Reversion Trading Strategy?
Mean reversion is a fundamental concept in trading strategies and finance that is based on the observation that, in many cases, asset prices tend to return to their average value over time. In other words, when an asset experiences extreme movements up or down, it is likely to return to its historical average level at some point.
This concept is based on statistics and is used to identify entry and exit points in trading. The main idea is that prices that deviate significantly from their mean will eventually return to it.
Characteristics of Mean Reversion Strategies
Mean reversion is a crucial concept in the field of trading that is based on the tendency of financial assets to return to their average. This phenomenon is grounded in the assumption that extreme prices, whether upward or downward, tend to correct themselves over time. In other words, after experiencing significant movements, assets have a propensity to move back toward their mean level.
This strategy is widely used by traders and investors to make informed decisions. It relies on the principle that markets cannot sustain extreme movements indefinitely, as factors such as supply and demand, as well as market events, eventually balance the conditions. For example, if an asset experiences a sudden increase in price, investors looking to profit from mean reversion might anticipate a downward correction and act accordingly, although we will delve into this topic in more detail later regarding strategies where we apply mean reversion.
Why Does the Mean Reversion Phenomenon Occur?
Mean reversion in trading is a phenomenon that finds its explanation in the complex interaction of various economic and psychological factors that affect financial markets. Essentially, this theory is based on the idea that, despite extreme short-term fluctuations, asset prices tend to return to their historical average due to the influence of forces that act to restore balance.
One of the fundamental reasons behind mean reversion is the cyclical nature of markets. Investors, influenced by fear and greed, often overreact to economic events or news, driving prices to temporary extremes. For example, if a company experiences a sharp drop in its stock price due to bad news, investors are likely to sell impulsively, causing an oversell. Over time, however, the company’s solid fundamentals may prevail, leading to an upward correction toward the historical average.
Additionally, mean reversion can also be understood through the concept of regression to the mean. Asset prices often deviate from their general trend due to exceptional events or extreme market conditions. However, these deviations are usually temporary, as investors tend to reassess the situation as additional information becomes available in the market.
Market psychology also plays a crucial role in mean reversion. Investors are prone to follow trends and react emotionally to market movements, which can lead to exaggerations in both directions. For example, if a stock has experienced a significant increase, investors may feel tempted to join the upward trend, but this emotional drive can inflate the price and eventually lead to a downward correction. Often, these situations arise due to FOMO (Fear Of Missing Out) or other cognitive biases, which result in emotional investments.
Ways to Create Mean Reversion Strategies
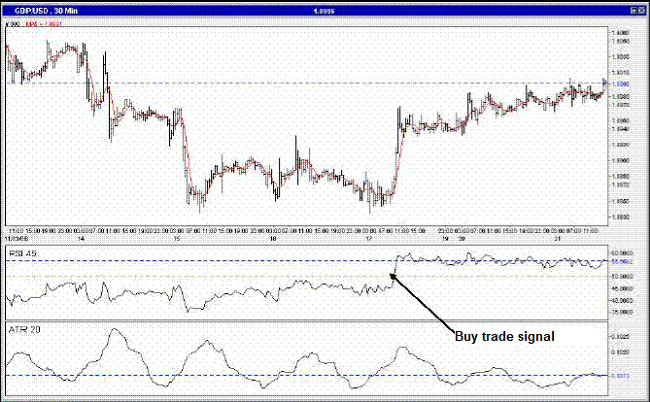
Indicators like the RSI (which I will discuss shortly) that signal extreme overbought or oversold conditions work very well.
Entry Rules
The indicators that work best for making entries in this type of strategy are:
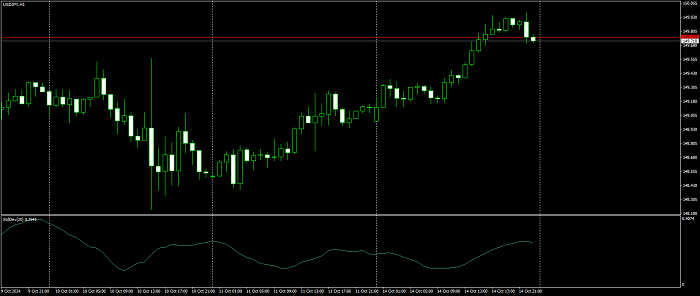
Standard Deviation
It measures dispersion, making it a good option for identifying moments of extreme deviation.
Bollinger Bands
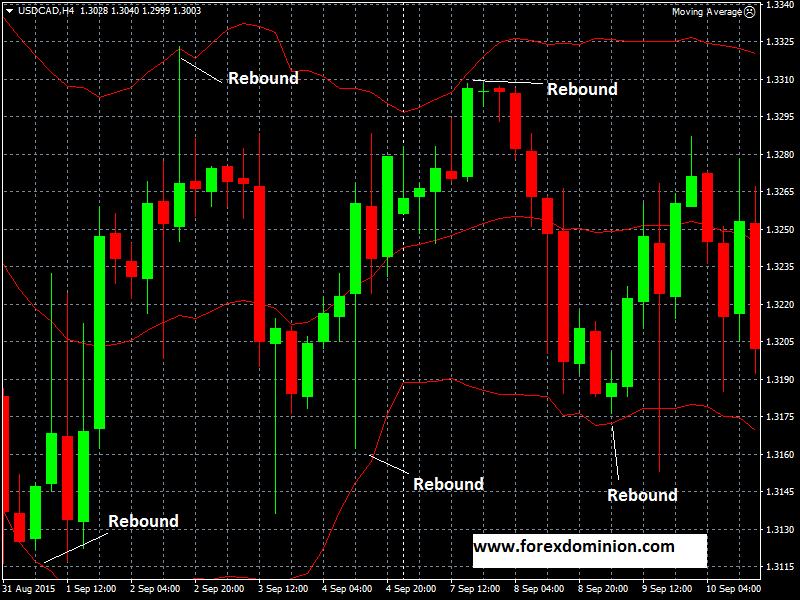
These are bands created based on the average of prices and their standard deviation. You can use the bands as extreme values, and when the price exceeds the upper band or falls below the lower band, you can position yourself in favor of the price returning to the mean.
More information on this indicator on: Bollinger bands indicator
RSI oscillator
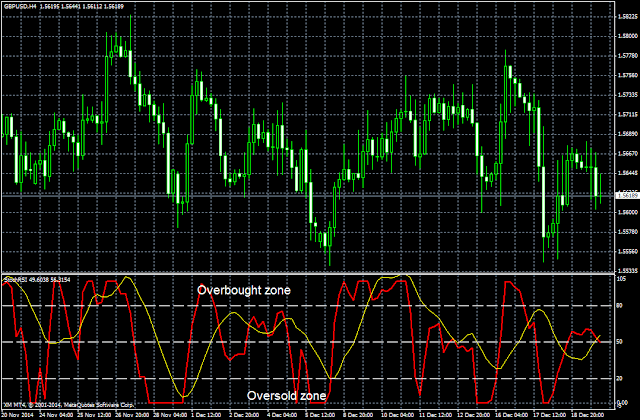
As I mentioned earlier, it is one of the best indicators, especially in short periods like RSI(2). Values of the RSI below 15 or above 85 are usually good levels to look for a reversal.
IBR
As its acronym indicates (Internal Bar Range), it represents the closing price in relation to the daily trading price. To clarify, it is calculated as follows:
IBR = (closing price – minimum) / (maximum – minimum)
Here, we look for values above 0.8 for sales and below 0.2 for purchases.
When combined with other indicators, it filters very well.
VIX Index
The VIX index measures volatility, so when fear rises and it spikes above 80, we can look for buying opportunities in the indices.
Exit Rules in Mean Reversion Strategies
Stop losses in trend-following strategies work well, but in mean reversion systems, they may not perform as effectively. One solution is to set a stop loss based on volatility (using the Average True Range). This way, it adapts well to market conditions.
Another exit strategy we can set for this type of system is time-based. If the price does not revert within X bars, exit the market. This is done because the longer it takes for the price to return, the lower the probability that it will.
We can also apply one of the indicators we used for entry to the exit.
Differences from Trend-Following Systems
Trend-following systems usually have a low success rate (between 30% and 45%). They tend to have few winning trades, but those that do win tend to win significantly. The volatility in results is often high, and they tend to work in streaks.
In fact, they are practically the opposite of mean reversion strategies.
Examples of Mean Reversion Strategies in Trading
In the case of mean reversion, it is a phenomenon widely used in the investment realm, and we can find numerous strategies. In this case, you will need to look for one that best suits your characteristics as an investor, whether you are more or less risk-averse. Here are four distinct strategies that involve mean reversion:
- Moving Average Crossover Strategy: A classic strategy that involves mean reversion is the use of moving averages. It can be implemented by looking for investment opportunities when there is a crossover of moving averages, such as a shorter moving average crossing above a longer one. For example, an investor might consider buying an asset when the short-term moving average crosses above the long-term moving average, suggesting a potential upward trend change.
- Bollinger Bands and Squeeze Strategy: Bollinger Bands, which represent volatility levels, can also be used in mean reversion strategies. When the bands tighten significantly (known as a “Squeeze”), it could indicate a low volatility phase and precede a sharp movement. Investors may consider taking positions opposite to the direction of the last movement to benefit from a mean reversion.
- RSI (Relative Strength Index) Strategy: The RSI is a momentum indicator that measures the speed and change of price movements. A strategy based on the RSI could involve identifying overbought or oversold levels (usually 70 and 30, respectively). When an asset is overbought, it might suggest that a downward correction is likely, and vice versa. Investors can look for mean reversion opportunities by entering positions contrary to the current trend when the RSI indicates extreme conditions.
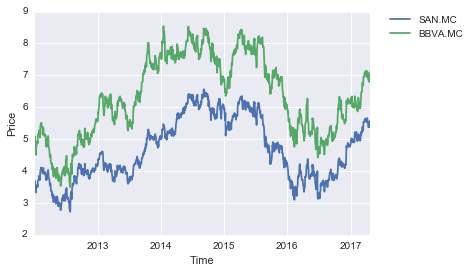
- Pairs Trading Strategy: Investors can also apply mean reversion in pairs trading strategies. This strategy involves identifying two assets that have historically shown significant correlation but have experienced deviations in their relative prices due to temporary events. By identifying these discrepancies, investors can take positions that anticipate a correction toward the historical relationship between the two assets.
Interest Rates
Similarly, some equilibrium models regarding interest rates suggest that interest rates also exhibit this property.
The equilibrium models that support mean reversion are the Vasicek model and the Cox, Ingersoll, and Ross (CIR) model. In other words, both the Vasicek model and the CIR model share the idea that interest rates have a long-term tendency to return to their average level.
When interest rates are high, the economy tends to slow down, leading to a decrease in the demand for capital from borrowers (investors). Over time (in the long term), interest rates decrease until they approach the average level.
When interest rates are low, the economy tends to accelerate, leading to an increase in the demand for capital from borrowers (investors). Over time (in the long term), interest rates increase until they approach the average level.
Conclusion
It is crucial to keep in mind that no strategy guarantees success in all scenarios, and risk is always present in trading. Moreover, the application of these strategies requires constant analysis and adaptation to the changing market conditions. Investing prudently and being aware of the associated risks is essential when applying mean reversion strategies. If you want to learn more about how moving averages work and their importance, feel free to visit the article.


