Fibonacci Retracement Trading System For Forex

Fibonacci sell trade example

In this article we are going to explain a trading system based on Fibonacci retracements and the weighted moving average (WMA), which can be used in any market and in most time frames. Therefore, it requires a basic knowledge of Fibonacci tools, although nothing complex.

Fibonacci tools can be found in the vast majority of trading platforms, such as Metatrader 4, so this system can be used on any platform that the trader chooses.

If you do not have knowledge about Fibonacci indicators, you can consult the following article: Fibonacci in Forex Trading

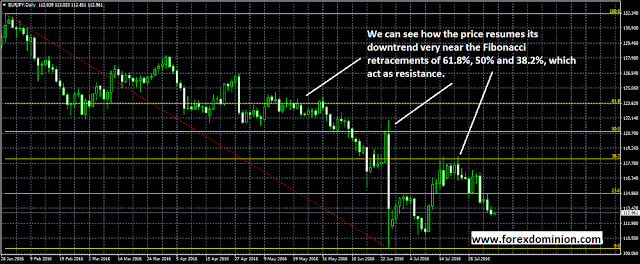
Basically, it is a technical trading system that focuses on opening positions in the trend direction, using Fibonacci retracements as price zones to enter the market. In other words, it is a trend following system. The WMA moving average is used to determine the best time to open positions.

Read more

Vegas Trading Strategy With Moving Averages Tunnels

A type of trading strategy that has been used for some years to trade successfully in the Forex market and with other financial instruments is based on moving averages tunnels such as the Vegas systems. In summary, these are discretionary systems for swing trading which are based on moving averages envelopes. To better understand how works this type of strategy we will explain in detail a system known as Vegas Wealth Builder.
 
The author of this strategy has defined the following steps for implementation:

Read more

Pure Trading System

This trading system seems to be relatively profitable because it quickly stops the losing trades and let the winners trades run, ie the ideal of all profitable trading systems. As with any strategy is very important to have discipline and follow the rules to the letter, not “hunches” or anything similar.
The first thing we will do is set the graphic settings as follows:
By using a SMA 50 in the High and a SMA 50 in the Low we form a channel which use is described below:

Read more

Fibonacci Pivot Points

Summary: In this article we describe the use and calculation of Fibonacci Pivot Points, a little known variant compared with traditional pivot points. The novelty about this tool is that it interestingly combines the pivots and Fibonacci sequence to determine support and resistance levels where there is high probability that the market made ​​major moves.

The pivot points in its different variations can be used in two ways: to display the main trend in the market that we are analyzing or to display price levels in which we can open and close a position. To identify the direction, if the price level of the pivot point is crossed in an upward motion, then we can say that the market is bullish, but if the break occurs in a downward movement, then the market is bearish. Generally, if prices remain above the pivot point then the upward trend will continue until an event cause a reverse in the price movement and when the price remains below this level then the market will continue its downward direction until something happens that force a change in the current trend.

Read more

Forms to use Fibonacci in Forex

The Fibonacci indicator is a very powerful tool in Forex trading. It provides important levels that can be used individually in conjunction with other indicators and methodologies such as Candlestick Patterns, Price Charts, RSI, MACD, Momentum etc, and that levels can be used to establish entry points, Stop loss levels and Take Profit levels.

The Fibonacci indicator can be plotted over any time frame including 5 min, 1hr, 4hr, daily etc.

The traditional way to plot and analyze the price with Fibonacci involves looking back at the historical prices to identify the most important highs and lows. Depending on the temporality that is used to trade the market this would involve seeing more historical data to locate those levels that will be the reference to the Fibonacci retracements and extensions. The convergence of different Fibonacci levels can occur if the levels are placed on graphs of different Time Frame, when doing this can exist a convergence and the level become more relevant.

Read more

The Fibonacci Extensions – Definition and Examples

The Fibonacci extensions, like Fibonacci retracements, are used to establish support and resistance levels, with the difference that the former are generally used as potential targets for profit taking, while retracements are often used as possible points of entry. For this reason, they are included in many trading systems to determine the best levels to exit the market. They are especially useful when markets are widespread.

This market analysis tools is widely included in modern trading platforms like Metatrader 4 and are used in much the same way as the retracements are used, as we saw in the article on Fibonacci retracements. Even some trading platforms allow to draw extensions and retracements in the same chart.

Read more

The Fibonacci Retracements in Trading

In technical analysisFibonacci Retracements refers to the possibility that the price of a financial asset, such as currency pairs, back off a considerable percentage of the original movement and find levels of support or resistance at the levels established by the Fibonacci numbers before resuming the original trend. These levels are built by drawing a trend line between the endpoints of the movement in question and applying the vertical distance the key percentages of 23%, 38.2%, 50%, 61.8%, 76.8% and 100% based on Fibonacci numbers.

Read more