Intraday Trading System Using Moving Averages and Stochastic

15 minutes intraday trading system

This  is quite simple intraday trading system for 15 minutes candlestick charts which is based on exponential moving averages (EMA) and the stochastic oscillator. The rules of this strategy are very simple as we shall see below: This trading system is specifically designed for intraday trading. For this reason all open positions using this technique should be closed at the … Read more

Trading System with RSI Oscillator and ATR Indicator

This trading strategy is ideal for traders who work full time but want to build a lucrative career as traders in the Forex or other markets, without having to sacrifice time from their work or other activities.

It is a system that uses several well-known and widely used technical indicators, the RSI, the moving averages and the ATR, to generate market entry and exit signals. These indicators are found in all graphical analysis packages on the market.

Read more

Noise free Forex trading system with Heikin Ashi candles

In this article, we are going to explain a simple trading system with Heikin Ashi charts to eliminate “market noise” so that we have a clearer picture of price action and especially trends. In this case, the methodology makes use of several modified indicators for Metatrader 4 based on Heikin Ashi candlesticks, which we include below for free download. Therefore, this system can only be used on this trading platform. One of its advantages is that it includes an alert indicator that shows us precisely when we must enter the market.

Basically, it is a trend-following system that seeks to enter the market during price corrections, in such a way that it gives us the possibility to open new positions at better prices. Its rules are quite clear and include rules for placing the stop loss and take profit target (based on another custom indicator).

As always, it is recommended to test this system in a demo account before using it to trade with real money.

Read more

Trading system for MT4 with RAVI FX Fisher and Market Guru indicators

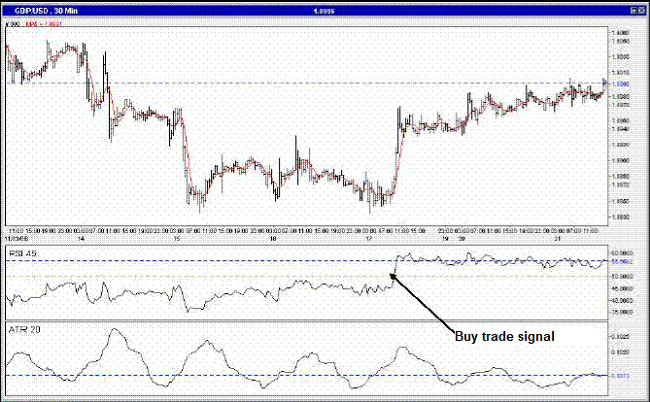
The trading system for MT4 that we are going to present below aims to enter market trends shortly after they begin. Therefore, it is not a counter-trend system, but rather a trend-following system that uses a series of technical indicators to detect changes in market direction as soon as possible.

It is a system based on a series of well-known technical indicators such as the JCCI and moving averages, although there are also modified indicators that were designed for Metatrader 4. Therefore, this methodology can only be applied to this trading platform.

Together, all these tools are designed to analyze the market trend and determine when a change is likely to occur. However, given that the trend changes are not easy to predict and before one occurs there may be false signals, especially in range markets, it is recommended that the trader always apply risk control and monetary management measures that decrease the impact of losing trades.

As always, it is recommended to test this system in a demo account before using it to trade with real money.

Read more

Double RSI Trading System for Forex

The trading system that we are going to present below is based on the use of two RSIs, as the name implies, specifically the crossings of two RSIs with different periods (One with a short period and the other with a longer period). As a filter of the signals generated by the crossings, the Fisher indicator is used, which allows having more reliable trading signals, since RSI crossings under certain market conditions can generate false signals and losses that could be avoided with the right filter.

The system itself is not complex. Long positions are opened at the RSI bullish crosses and short positions at the RSI bearish crosses. The Fisher indicator is used as a tool to confirm the different signals.

As always, it is recommended to test the system in a demo account before using it to trade with real money.

Read more

Forex Intraday Trading System ProEMAGain

This Forex intraday system is based, mainly, on an interesting custom indicator for Metatrader 4 called ProEMAGain. This indicator consists of three exponential moving averages (EMA), and an RSI indicator. These indicators are common tools for the analysis of the Forex market, but here they are combined, originating a very profitable system. This combination gives the right and necessary information, in addition to being visually effective, to make decisions quickly and correctly.

It is recommended to trade with this trading strategy only in the major currency pairs: EUR/USD, GBP/USD, USD/JPY, USD/CHF, AUD/USD, and NZD/USD.

Read more

Simple trading methods. Long-term trends following


Continuing with simplicity in concepts and strategies, we will present some simple trading methods. These are certain methods for long-term trends following.

As a historical note about this type of methods, we can say that they have been there since “the origin of time” and, if they have not disappeared is for something and is that simple and effective trading methods endure in time unlike others, much more Sophisticated and complicated, that stop working and disappear.

Read more

Trading system with 1-2-3 pattern and Bollinger Bands

In this article we will explain a trading strategy that combines the use of Bollinger Bands and the 1-2-3 pattern, a very powerful chart pattern used by many traders in a variety of markets. It is a simple strategy as we shall see below, however, it requires mastery of a number of theoretical concepts that we will explain below.

The 1-2-3 maximum that originate in the upper bollinger band or moving average line (center line of the Bollinger Bands) and the 1-2-3 minimum which originate in the lower bollinger band or the moving average line, provide excellent signals that indicate possible changes of direction in the market. Because the 1-2-3 pattern occurs in virtually every market and any time frame, this strategy can be applied to trade in a variety of instruments and time frames, including short, medium and long term.

Read more

Perfect Order Trading Strategy – Description and Example

What is the perfect order?

The perfect order of moving averages is defined as a set of simple or exponential moving averages that are aligned consecutively depending on the trend. For example, in the case of a bullish trend, a perfect order would be that a moving average of 10 periods were in a higher price level to a moving average of 20 periods which in turn would be higher than a moving average of 50 periods and so on. In other words, in an upward trend, moving averages are aligned from major to minor period upwards.

In the case of a downtrend, the opposite is true, ie that moving averages are lined up from smallest to largest period. For example, above the 10 period moving average would be the moving average of 20 periods which in turn would be below the moving average of 50 periods and so on. This alignment of moving averages is the basis of the perfect order trading strategy that we will describe below:

Example of a perfect order in an uptrend:

Read more

Trading strategy based on the Parabolic SAR and volume

The Parabolic system price/time is another idea that introduced the famous Welles Wilder in his book “New Concepts in Technical Trading Systems“. This system was developed as a high and reversal strategy, which means that a trader using this approach will always have either a buy position or a short position in the market. Here we must remember that when the Parabolic SAR generates a buy signal, for example, a series of bullish points  appears below the current price action. As the market moves higher, the indicator points also rise, first slowly and then faster.

When the trend is stopped or begins to reverse, points and prices intersect, in which case a long position is closed and a new short position is open. For this system, we want to determine whether the addition of a volume requirement for Parabolic SAR entry signals can improve the performance of these signals. For example, the buy signal for this system is when a high in price reaches a point of Parabolic SAR above the market with a volume higher than the simple moving average of 5 periods (five bars) of volume. Both conditions must be met in the same bar.

Read more