Expanding Triangle – How to trade with this price pattern?

Expanding triangle price pattern

What is the expanding triangle pattern? The expanding triangle pattern, also known simply as expansionary formation, is formed during periods of very high market volatility, with many price oscillation and a not very clear trend. With each swing the pattern expands further, forming two opposite trend lines. An expanding triangle consists of a series of swings that widen as price … Read more

The Best Forex Daytrading Strategies IV

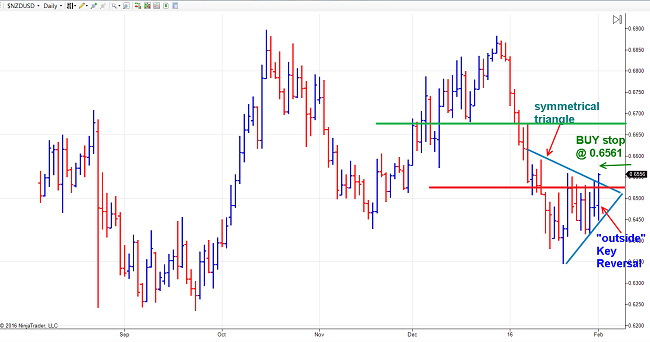
Reversal Symmetrical Triangle Strategy

In this article we finish the series on daytrading and scalping strategies based exclusively on price action applicable to Forex and other markets, we hope you have liked it.

These strategies are based on the identification of classic price patterns from technical analysis.

You can access the third article in the series at the following link: The Best Forex Daytrading Strategies III

Read more

The Best Forex Daytrading Strategies III

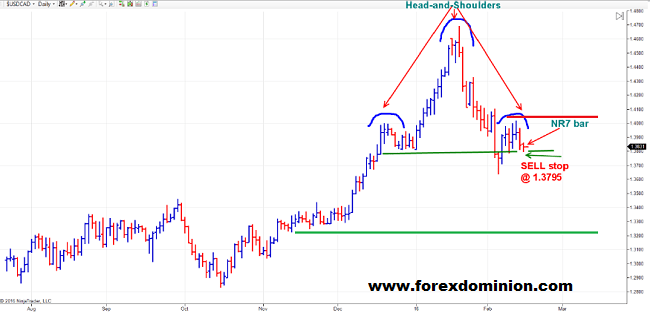
Head and Shoulders strategy

In this article we will continue with the series of articles on scalping and daytrading strategies based exclusively on Price Action that may be useful for you to trade in Forex, although they can also be adapted to other markets.

These strategies are based on the identification of classic price patterns from technical analysis.

You can access the second article in the series at the following link: The Best Forex Daytrading Strategies II

Read more

The Rectangle Pattern – Trend continuation chart pattern

Rectangle pattern

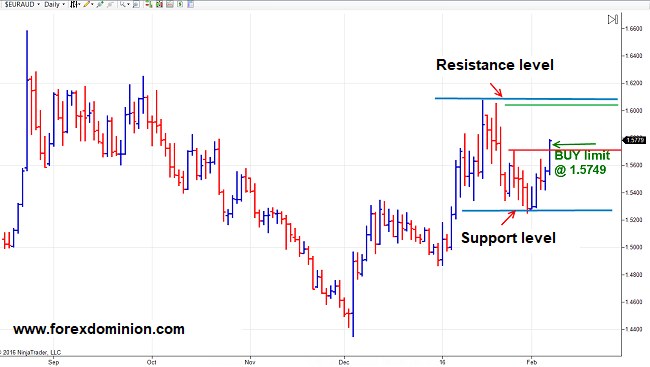
The rectangle is a trend continuation pattern and consists of a price formation in which demand and supply are apparently balanced for a certain period of time. The price moves in a narrow range where it finds a support at the bottom of the rectangle and a resistance at the top of the figure.

Finally, the price ends up breaking out the rectangle range, either through support or resistance. If the previous trend was bullish, then the breakout is most likely to be bullish, but if the previous trend was bearish, the move will most likely be bearish.

However, the rectangle can also be a reversal trend pattern, for example if the previous trend was bullish and the pattern breakout occurs on the downside or when the previous trend was bearish and the price breaks through resistance.

Read more

The Best Forex Daytrading Strategies II

In a previous article we explained some basic day trading strategies for Forex and other markets, mainly based on price action.

Continuing with the series on daytrading strategies based exclusively on Price Action (the most common price patterns), we are now going to present another series of strategies based on classic price patterns of technical analysis.

You can access the first article in the series at the following link: The Best Forex Daytrading Strategies I

Read more

The Best Forex Daytrading Strategies

In this article, we present a complete collection of ideas to build daytrading strategies based exclusively on price action that can be useful to trade in Forex, although they can also be adapted to other markets. By the way, I have been told that these strategies were used on a trading desk of a well-known US investment bank. Although logically I have not been able to corroborate this, the truth is that these trading ideas are at the least original since they combine different patterns in an unusual way. Having said that, we will now study these strategies in detail.

Read more

Cup with Handle Pattern – Definition and Features

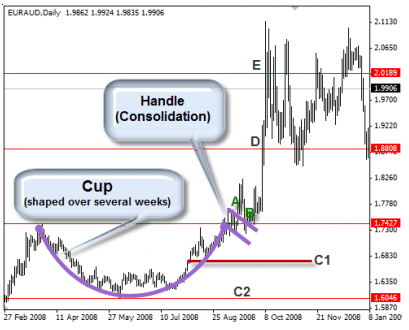
One of the most useful chart price patterns in trading is the the cup and handle pattern. It does not appear very often in the Forex market but when it appears the chances of a good entry are very large. As with many chart patterns, its use is recommended mainly in long-term graphics and not so much in short-term time frames. The cup and handle formation consists of two parts. The first part is a low U-shaped formation that forms the “cup.” After the cup a consolidation period appears that forms the handle, the handle of the cup.

Read more

What is a bullish trend channel?

An ascending channel is a chart pattern formed by two parallel lines and with ascending inclination that contains the price action. It is also known as a bullish trend channel or simply a bullish channel. Although the price does not always adapt perfectly to the interior of the canal, the lines that form it point to important support and resistance areas.

The price channels show graphically the market trend and are a useful tool for their ability to predict changes in the general market trend. As long as the price remains inside the ascending channel, the bullish trend will continue, much more if there is a maximum above the upper line. On the contrary, the breakout of the lower line is a bearish signal and it can mean a possible change of trend.

Read more

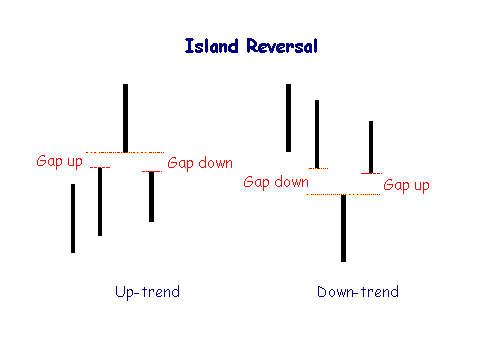
Island Reversal Price Pattern

Description of the Island Reversal

Island reversal is a trend change pattern which forms a gap on both sides. This chart pattern is most likely shown when the market trend proceeds to its last level. The name island reversal is obtained from the fact which the candlestick appearing alone, that is quite alike in the island. This chart pattern explains an increase in the volume amidst the primary gap and the following gap proceeding in the opposite direction.

The island reversal pattern is driven across the pre-market trading and pro trading as well. Generally, the island reversal chart pattern is described as a distinct trading activity that works within a range and moreover it is separated with a move. The separation is resulted due to an exhaustion gap and the opponent direction results with a breakthrough gap.

Read more