To perform a consistent technical analysis, it is necessary to know what are the most important indicators to make our trading decisions. If you are starting your career in the world of trading, the price charts of different currency pairs can be overwhelming at first. In addition, it is confusing to know what are the most appropriate technical indicators to study for each price chart.
In this article, we are going to see the four basic groups of technical indicators that exist based on the information that each one presents. In ForexDominion we already have several articles that explain exactly how all these financial indicators work and how you can use them to analyze trends, price objectives, and strategies. Therefore, we are not going to focus on saying which type of technical indicator is the best, since each trader has its own tastes and strategies, neither in specific details of the indicators but in the general characteristics of these analysis tools, since our goal is to help the reader to better understand each indicator and its use.

What are the technical indicators?
A technical indicator is nothing more than a mathematical relationship that indicates some particular statistical data about a market asset. Technical indicators allow traders to study price behavior further. They are essential for a consistent technical analysis and are the basic tools of any trader. In Forex, these indicators offer an idea of the performance of a currency pair. In general, these indicators generate numerical figures that must be interpreted, but most of them are represented graphically since it facilitates their study. Here we refer specifically to the indicators used in the technical analysis. These are also known as technical indicators. They should not be confused with traditional financial indicators, which measure results in the finances of a company, an individual, or a state (macroeconomic indicators).
The four basic types of indicators for technical analysis
In general, any technical indicator used in trading can be included in any of these categories. Everything will depend on the type of information they provide:
- Trend indicators
- Momentum indicator
- Volatility Indicators
- Volume indicator
Trend indicators
Trend indicators are used to indicate the direction of the market, that is, the direction of the trend. There are innumerable indicators of this type.
The trend indicators may be the best known and used as one of the golden rules that you will always hear when talking about Forex trading, and in financial markets in general, is that you should trade in the direction of the trend and not against it. Although this rule, like all others, has its detractors and exceptions, there are even counter-trend strategies that are based on trades that contravene this rule.
Some examples of trend-following indicators are the Parabolic SAR or the Moving Averages.
Momentum indicators
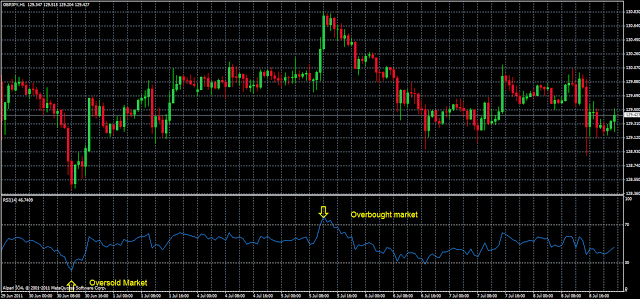
The momentum indicators measure the strength and/or speed of a directional movement in the price. This type of indicator is the best to determine a change in the price direction. Most momentum indicators are oscillators that show overbought or oversold areas.
Examples of momentum indicators are the CCI (Commodity Channel Index), RSI (Relative Strength Index) or the stochastic oscillator.
Volatility Indicators
As the name implies, these financial indicators show information regarding changes in market volatility. The most prominent examples of volatility indicators are the ATR, Bollinger bands, or envelopes.
Volume indicators
The volume indicators are used to show the trading volume in a particular currency. These indicators are generally very useful for confirming trend changes or the signals generated by a breakout. For example, if a given currency pair is trading in a narrow range for a certain time and breaks this range upwards, this buy signal would be confirmed if we see an increase in the trading volume during the breakout. Examples of this type of technical indicator are the Chaikin Money Flow, the Demand Index, or the On Balance Volume (OBV).
And now that you know the different types of indicators used in technical analysis and their main characteristics, you can take a look at another of my articles related to this topic: What types of indicators do I need in my trading strategy? Here we discuss the idea that an ideal set of indicators should contain at least one of each type. But remember: the technical analysis with any set of indicators does not assure a 100% success rate. Thus, these indicators are nothing more than a helpful tool to make your trading decisions.
You can get more information on technical indicators in the following guide: Tutorial on technical indicators


![Technical trading indicators [Complete guide] MACD-indicator-example](https://www.forexdominion.com/wp-content/uploads/2020/06/MACD-indicator-example.png)


